TD Bank 2003 Annual Report Download - page 13
Download and view the complete annual report
Please find page 13 of the 2003 TD Bank annual report below. You can navigate through the pages in the report by either clicking on the pages listed below, or by using the keyword search tool below to find specific information within the annual report.-
 1
1 -
2
-
 3
3 -
 4
4 -
 5
5 -
 6
6 -
 7
7 -
 8
8 -
 9
9 -
 10
10 -
 11
11 -
 12
12 -
 13
13 -
 14
14 -
 15
15 -
 16
16 -
 17
17 -
 18
18 -
 19
19 -
 20
20 -
 21
21 -
 22
22 -
 23
23 -
24
-
25
-
26
-
27
-
28
-
29
-
30
-
31
-
32
-
33
-
34
-
35
-
36
-
37
-
38
-
39
-
40
-
41
-
42
-
43
-
44
-
45
-
46
-
47
-
48
-
49
-
50
-
51
-
52
-
53
-
54
-
55
-
56
-
57
-
58
-
59
-
60
-
61
-
62
-
63
-
64
-
65
-
66
-
67
-
68
-
69
-
70
-
71
-
72
-
73
-
74
-
75
-
76
-
77
-
78
-
79
-
80
-
81
-
82
-
83
-
84
-
85
-
86
-
87
-
88
-
89
-
90
-
91
-
92
-
93
-
94
-
95
-
96
-
97
-
98
-
99
-
100
-
101
-
102
-
103
-
104
-
105
-
106
-
107
-
108
 |
 |

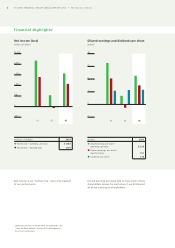
TD BANK FINANCIAL GROUP ANNUAL REPORT 2003 • Management’s Discussion and Analysis 11
Net income (loss)
In its simplest terms, net income is revenues less expenses,
loan losses and income taxes.
Reported net income was $1,076 million in 2003, compared
with reported net loss of $67 million in 2002 and reported
net income of $1,392 million in 2001. Reported basic earn-
ings per share were $1.52 in 2003 compared with a loss per
share of $.25 in 2002 and reported basic earnings per share
of $2.07 in 2001. Reported diluted earnings per share were
$1.51 in 2003 compared with a loss per share of $.25 in
2002 and reported diluted earnings per share of $2.05 in
2001. Reported return on total common equity was 8.7% in
2003 compared with (1.3)% in 2002 and 11.3% in 2001.
In 2003, operating cash basis net income was $1,567 mil-
lion, compared with $535 million in 2002 and $2,167 million
in 2001. On an operating cash basis, basic earnings per share
were $2.28 in 2003 compared with $.69 in 2002 and $3.31
in 2001. Diluted earnings per share on an operating cash
basis were $2.26 in 2003 compared with $.68 in 2002 and
$3.27 in 2001. Operating cash basis return on total common
equity was 13.0% compared with 3.6% in 2002 and 18.0%
in 2001.
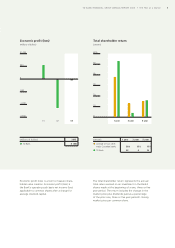
Economic profit (loss)
The Bank utilizes economic profit (loss) as a tool to measure
shareholder value creation. Economic profit (loss) is operating
cash basis net income (loss) applicable to common shares
after a charge for average invested capital. Average invested
capital is equal to average common equity plus the cumula-
tive after-tax amount of goodwill and intangible assets
amortized as of the reporting date. Average invested capital
is increased by previously amortized goodwill and intangibles
because this amortization is (as previously explained) excluded
in operating cash basis net income. The rate used in the
charge for capital is the equity cost of capital as determined by
reference to the Capital Asset Pricing Model. The charge rep-
resents a required return to common shareholders. The Bank’s
goal is to achieve positive and growing economic profit.
Return on average invested capital (ROIC) is operating cash
basis net income (loss) applicable to common shares, divided
by average invested capital. ROIC is a variation on the eco-
nomic profit measure that is useful in comparison to equity
cost of capital. Both ROIC and the cost of capital are ratios,
while economic profit is a dollar measure. When ROIC
exceeds the equity cost of capital, economic profit is positive.
The Bank’s goal is to achieve ROIC that exceeds the equity
cost of capital.
Economic profit and ROIC are not defined terms under
GAAP, and therefore may not be comparable to similar terms
used by other issuers. The table below provides a reconcilia-
tion between the Bank’s economic profit and operating cash
basis results which are discussed in the “How the Bank
Reports” section.
Net income (loss)
(millions of dollars)
030201
Net income (loss) –
reported basis
Net income (loss) –
operating cash basis
$2,500
2,000
-500
0
1,500
1,000
500
(millions of dollars)
030201
Net income applicable
to common shares –
operating cash basis
Economic profit (loss)
$3,000
2,000
-2,000
-1,000
0
1,000
Economic profit (loss)
Reconciliation of economic profit and operating cash basis results
(millions of dollars) 2003 2002 2001
Average common equity $ 11,396 $ 12,144 $ 11,505
Average cumulative amount of non-cash goodwill/intangible amortization,
net of income taxes 2,396 1,881 1,196
Average invested capital $ 13,792 $ 14,025 $ 12,701
Rate charged for invested capital 10.9% 11.2% 12.0%
Charge for invested capital1 (1,530) (1,574) (1,526)
Net income applicable to common shares – operating cash basis 1,480 442 2,075
Economic profit (loss) $(50) $ (1,132) $ 549
Return on average invested capital 10.5% 3.2% 16.3%
1Includes $26 million after-tax charge for past amortization of impaired
goodwill recognized in the second quarter of 2003.