TD Bank 2003 Annual Report Download - page 14
Download and view the complete annual report
Please find page 14 of the 2003 TD Bank annual report below. You can navigate through the pages in the report by either clicking on the pages listed below, or by using the keyword search tool below to find specific information within the annual report.-
 1
1 -
2
-
3
-
 4
4 -
 5
5 -
 6
6 -
 7
7 -
 8
8 -
 9
9 -
 10
10 -
 11
11 -
 12
12 -
 13
13 -
 14
14 -
 15
15 -
 16
16 -
 17
17 -
 18
18 -
 19
19 -
 20
20 -
 21
21 -
 22
22 -
 23
23 -
 24
24 -
25
-
26
-
27
-
28
-
29
-
30
-
31
-
32
-
33
-
34
-
35
-
36
-
37
-
38
-
39
-
40
-
41
-
42
-
43
-
44
-
45
-
46
-
47
-
48
-
49
-
50
-
51
-
52
-
53
-
54
-
55
-
56
-
57
-
58
-
59
-
60
-
61
-
62
-
63
-
64
-
65
-
66
-
67
-
68
-
69
-
70
-
71
-
72
-
73
-
74
-
75
-
76
-
77
-
78
-
79
-
80
-
81
-
82
-
83
-
84
-
85
-
86
-
87
-
88
-
89
-
90
-
91
-
92
-
93
-
94
-
95
-
96
-
97
-
98
-
99
-
100
-
101
-
102
-
103
-
104
-
105
-
106
-
107
-
108
 |
 |

TD BANK FINANCIAL GROUP ANNUAL REPORT 2003 • Management’s Discussion and Analysis12
Net interest income
The Bank calculates net interest income by adding the
interest and dividends it earns from loans and securities,
and subtracting the interest it pays on deposits and
other liabilities.
Net interest income is calculated on a taxable equivalent
basis (TEB), which means that the value of non-taxable
or tax-exempt income such as dividends is adjusted to
its equivalent before tax value. This allows the Bank to
measure income from all securities and loans consistently
and makes for a more meaningful comparison of net
interest income with other institutions.
See supplementary information page 45 and 46, tables 2, 3 and 4
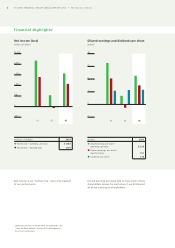
Net interest income (TEB) was $5,846 million in 2003, a
year-over-year increase of $324 million or 6%. The increase
in net interest income is related to Personal and Commercial
Banking where average personal loan volumes – excluding
securitizations – increased $5 billion from a year ago; however
this growth was partially offset by a 14 basis point reduction
in the net interest margin to 3.28%. The increase is also
related to higher interest income in Wealth Management due
to higher cash balances in domestic operations combined
with higher yields earned on the investment of the cash
balances. In addition, the increase in net interest income
related to interest income from income tax refunds and
taxable equivalent and securitization adjustments in 2003.
Net interest income excluding the TEB adjustment for 2003
was $5,616 million, an increase of $316 million compared
with 2002.
Net interest income (TEB) was $5,522 million in 2002, a
year-over-year increase of $886 million or 19%. Net interest
income reported by Wholesale Banking increased by $607 mil-
lion as compared with 2001, primarily related to an increase
in interest income from trading securities. Net interest income
for Personal and Commercial Banking increased by $107 mil-
lion as compared with 2001. The increase in Personal and
Commercial Banking was attributable to personal loan vol-
umes, excluding securitizations, which increased by $5 billion,
and the net interest margin improvement of four basis points
to 3.42%. Net interest income excluding the TEB adjustment
for 2002 was $5,300 million, an increase of $909 million
compared with 2001.
Other income
Other income represents all of our income other than net
interest income. Sources of other income include revenues
from trading activities, brokerage fees, mutual fund
management fees, service fees, income from loan
securitizations and other revenue.
See supplementary information page 47, tables 5 and 6
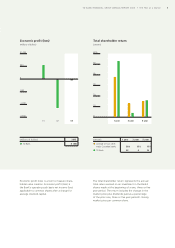
Other income on an operating cash basis was $4,424 million
in 2003, a decrease of $465 million or 10% from 2002, after
excluding the special gain from the sale of the Bank’s mutual
fund record keeping and custody business in 2002. In the
first and third quarters of 2002, the Bank sold its mutual fund
record keeping and custody business and recorded a pre-tax
gain of $18 million and $22 million, respectively. The Bank
has excluded these special gains in analyzing its performance
as they are not recurring events. Reported other income was
$4,424 million for 2003, a decrease of $505 million or 10%
from 2002.
Trading income reported in other income decreased by
$425 million or 80% compared with 2002, while trading-
related income generated by Wholesale Banking – which is
the total of trading income reported in other income and
the net interest income on trading positions reported in net
interest income – was $1,158 million for the year, a decrease
of $195 million or 14% compared with 2002. The decrease
reflects a decline in market activity levels across equity and
interest rate structured products compared with last year. The
investment securities portfolio realized net gains of $23 mil-
lion in 2003 compared with gains of $26 million in 2002. The
decrease is primarily attributable to market conditions.
Overall, the investment securities portfolio has a surplus over
its book value of $429 million compared with $228 million at
the end of 2002. The decline in other income was also due to
losses on derivative and loan sales not booked to sectoral in
Wholesale Banking of $113 million. In addition, the decline in
other income related to write downs of $39 million in 2003,
resulting from other than temporary impairments in certain
international wealth management joint ventures. Non-trading
foreign exchange income decreased by $61 million in 2003
to address a previously unhedged non-trading U.S. dollar expo-
sure arising from our U.S. dollar Visa business. Somewhat
offsetting the decline in other income were increases in dis-
count brokerage fees and commissions of $35 million or 4%
and full service brokerage fees and other securities services
fees of $26 million or 4% compared with last year. Also, off-
setting the decline was a year-over-year increase in fees from
card services and service charges of $48 million or 6%, an
increase in insurance revenues of $45 million or 12% and an
increase in income from loan securitizations of $32 million or
15% as compared with 2002.
Other income was $4,889 million in 2002, a decrease of
$1,208 million or 20% from 2001, after excluding special
gains from the sale of the Bank’s mutual fund record keeping
and custody business in 2002 and special gains from the sale
of certain investment real estate assets in 2001. During fiscal
2001, the Bank sold certain investment real estate for a pre-
tax gain on sale of $350 million, net of deferrals. The Bank
has excluded these special gains in analyzing its performance
as they are not recurring events. Reported other income was
$4,929 million for 2002, a decrease of $1,518 million or 24%
from 2001.
Net interest income
(millions of dollars)
0301 02
Net interest income
excluding TEB
Net interest income
including TEB
$6,000
0
4,000
3,000
2,000
1,000
5,000