TD Bank 2003 Annual Report Download - page 15
Download and view the complete annual report
Please find page 15 of the 2003 TD Bank annual report below. You can navigate through the pages in the report by either clicking on the pages listed below, or by using the keyword search tool below to find specific information within the annual report.-
 1
1 -
2
-
3
-
4
-
 5
5 -
 6
6 -
 7
7 -
 8
8 -
 9
9 -
 10
10 -
 11
11 -
 12
12 -
 13
13 -
 14
14 -
 15
15 -
 16
16 -
 17
17 -
 18
18 -
 19
19 -
 20
20 -
 21
21 -
 22
22 -
 23
23 -
 24
24 -
 25
25 -
26
-
27
-
28
-
29
-
30
-
31
-
32
-
33
-
34
-
35
-
36
-
37
-
38
-
39
-
40
-
41
-
42
-
43
-
44
-
45
-
46
-
47
-
48
-
49
-
50
-
51
-
52
-
53
-
54
-
55
-
56
-
57
-
58
-
59
-
60
-
61
-
62
-
63
-
64
-
65
-
66
-
67
-
68
-
69
-
70
-
71
-
72
-
73
-
74
-
75
-
76
-
77
-
78
-
79
-
80
-
81
-
82
-
83
-
84
-
85
-
86
-
87
-
88
-
89
-
90
-
91
-
92
-
93
-
94
-
95
-
96
-
97
-
98
-
99
-
100
-
101
-
102
-
103
-
104
-
105
-
106
-
107
-
108
 |
 |

TD BANK FINANCIAL GROUP ANNUAL REPORT 2003 • Management’s Discussion and Analysis 13
Trading income reported in other income decreased by
$789 million in 2002, while trading related income generated
by Wholesale Banking was $1,353 million for the year, a
decrease of $184 million or 12% as compared with 2001.
This was a solid performance given the decrease in market
volatility, the continued slow down in corporate origination
activity and weak credit markets experienced during 2002.
The investment securities portfolio realized net gains of only
$26 million in 2002. This represents a significant decrease
from net investment securities gains of $216 million in 2001.
The decrease is primarily attributable to weaker equity mar-
kets leading to fewer exit opportunities in 2002. Overall, the
equity investment securities portfolio continued to have a
surplus over its book value of $228 million compared with
$370 million at the end of 2001. The decline in other income
also reflects a decrease in self-directed brokerage revenues
of $80 million, or 8%, compared with 2001. This decrease
reflects a 15% drop in average trades per day to 98,900 from
116,000 in 2001. Income from loan securitizations decreased
by $54 million, or 20%, as compared with 2001, as a result
of lower levels of securitized assets. Partially offsetting this
decline in other income was a year-over-year increase in
insurance revenues of $49 million or 15%. Also contributing
to the overall decline in other income was a decrease in
property rental income of $52 million as the Bank sold
substantially all of its investment real estate in fiscal 2001.
Expenses
Expenses include non-interest expenses, such as salaries,
occupancy and equipment costs, and other operating
expenses.
See supplementary information page 45 and 48, table 1 and 7
Operating cash basis expenses exclude non-cash goodwill
and identified intangible amortization and restructuring costs
related to acquisitions and significant business restructuring
initiatives. During the fourth quarter of fiscal 2001, Wholesale
Banking announced a restructuring of its operations, which
resulted in pre-tax restructuring costs of $130 million,
primarily related to employee severance. In fiscal 2001, the
Bank incurred pre-tax restructuring costs of $54 million
related to TD Waterhouse and $55 million related to the
acquisition of Newcrest. Beginning in fiscal 2002, the Bank
discontinued the amortization of goodwill as a result of the
adoption of the new accounting standard on goodwill and
intangible assets.
In 2003, operating cash basis expenses increased $838 mil-
lion to $7,592 million compared with 2002. The increase in
expenses is primarily a result of $624 million in goodwill write
downs related to the international unit of the Bank’s wealth
management business and its U.S. equity options business in
Wholesale Banking recognized in the second quarter of 2003.
During the second quarter of 2003, the Bank reviewed the
value of goodwill assigned to these businesses and deter-
mined that an impairment had occurred. In addition, during
the second quarter 2003 the Bank determined that it was
necessary to restructure these operations and, as a result,
recorded $87 million in restructuring costs in the second
quarter and $5 million in the third quarter of 2003. The
increase in expenses is also related to increased variable
compensation expenses and charges related to systems
write-offs, real estate downsizing, legal provisions in the non-
core portfolio and costs of streamlining core operations in
Wholesale Banking. On a reported basis, expenses increased
by $612 million from a year ago to $8,364 million. The
impact of non-cash intangible amortization on the Bank’s
reported expenses in 2003 was $772 million compared with
$998 million last year. Beginning in fiscal 2003, the Bank has
applied the fair value method of accounting for stock options
and recorded an expense of $9 million.
In 2002, total operating cash basis expenses decreased by
$171 million or 2% from 2001 to $6,754 million, primarily as
a result of lower incentive compensation expenses in
Wholesale Banking. Wealth Management also contributed to
the decrease in salaries and employee benefits as a result of
its discount brokerage restructuring initiatives. On a reported
basis, expenses decreased by $902 million from 2001 to
$7,752 million. The impact of non-cash goodwill and intangi-
ble amortization on the Bank’s reported expenses in 2002
was $998 million compared with $1,490 million in 2001.
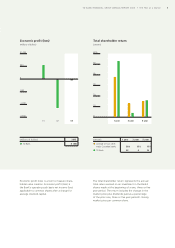
Expenses
(billions of dollars)
Expenses –
reported basis
Expenses –
operating cash basis
$10
0
6
8
4
2
0301 02
Other income
(billions of dollars)
0301 02
Net investment
securities gains
Investment and
securities services
Credit fees
Insurance
Other
Trading income
$3.0
2.5
0
2.0
1.5
1.0
.5