TD Bank 2001 Annual Report Download - page 5
Download and view the complete annual report
Please find page 5 of the 2001 TD Bank annual report below. You can navigate through the pages in the report by either clicking on the pages listed below, or by using the keyword search tool below to find specific information within the annual report.-
 1
1 -
 2
2 -
 3
3 -
 4
4 -
 5
5 -
 6
6 -
 7
7 -
 8
8 -
 9
9 -
 10
10 -
 11
11 -
 12
12 -
 13
13 -
 14
14 -
 15
15 -
 16
16 -
17
-
18
-
19
-
20
-
21
-
22
-
23
-
24
-
25
-
26
-
27
-
28
-
29
-
30
-
31
-
32
-
33
-
34
-
35
-
36
-
37
-
38
-
39
-
40
-
41
-
42
-
43
-
44
-
45
-
46
-
47
-
48
-
49
-
50
-
51
-
52
-
53
-
54
-
55
-
56
-
57
-
58
-
59
-
60
-
61
-
62
-
63
-
64
-
65
-
66
-
67
-
68
-
69
-
70
-
71
-
72
-
73
-
74
-
75
-
76
-
77
-
78
-
79
-
80
-
81
-
82
-
83
-
84
-
85
-
86
-
87
-
88
 |
 |

5
10
15
20
$25
0
00 01
1
2
3
$4
0
1As a percentage of net average loans including customers’ liability under
acceptances and excluding securities purchased under resale agreements and
excluding increases in general allowances.
Source: BMO Nesbitt Burns, Total Return Performance: The World Series Among the “Big 5”,
November 10, 2000, updated with supplementary information from quarterly Bank reports.
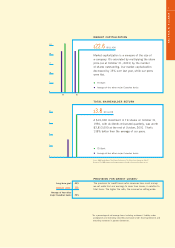
MARKET CAPITALIZATION
$22.6 BILLION
Market capitalization is a measure of the size of
a company. It’s calculated by multiplying the share
price (as at October 31, 2001) by the number
of shares outstanding. Our market capitalization
decreased by 13% over last year, while our peers
were flat.
TD Bank
Average of four other major Canadian banks
TOTAL SHAREHOLDER RETURN
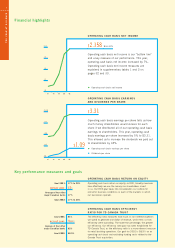
$3.8 MILLION
A $10,000 investment in TD shares on October 31,
1960, with dividends reinvested quarterly, was worth
$3,813,000 at the end of October, 2001. That’s
138% better than the average of our peers.
TD Bank
Average of four other major Canadian banks
PROVISION FOR CREDIT LOSSES1
The provision for credit losses ratio measures how much money
we set aside from our earnings to cover loan losses, in relation to
total loans. The higher the ratio, the more we’re setting aside.
Long-term goal: .35%
RESULT 2001: .48%
Average of four other
major Canadian banks .73%
3
THE YEAR AT A GLANCE