TD Bank 2001 Annual Report Download - page 21
Download and view the complete annual report
Please find page 21 of the 2001 TD Bank annual report below. You can navigate through the pages in the report by either clicking on the pages listed below, or by using the keyword search tool below to find specific information within the annual report.-
 1
1 -
2
-
3
-
4
-
5
-
6
-
7
-
8
-
9
-
10
-
 11
11 -
 12
12 -
 13
13 -
 14
14 -
 15
15 -
 16
16 -
 17
17 -
 18
18 -
 19
19 -
 20
20 -
 21
21 -
 22
22 -
 23
23 -
 24
24 -
 25
25 -
 26
26 -
 27
27 -
 28
28 -
 29
29 -
 30
30 -
 31
31 -
32
-
33
-
34
-
35
-
36
-
37
-
38
-
39
-
40
-
41
-
42
-
43
-
44
-
45
-
46
-
47
-
48
-
49
-
50
-
51
-
52
-
53
-
54
-
55
-
56
-
57
-
58
-
59
-
60
-
61
-
62
-
63
-
64
-
65
-
66
-
67
-
68
-
69
-
70
-
71
-
72
-
73
-
74
-
75
-
76
-
77
-
78
-
79
-
80
-
81
-
82
-
83
-
84
-
85
-
86
-
87
-
88
 |
 |

19
HOW WE PERFORMED IN 2001
MANAGEMENT’S DISCUSSION AND ANALYSIS OF OPERATING PERFORMANCE
much lower margin than loan products, they contribute to net
interest income and have minimal credit risk, making them less
capital intensive.
Interest expense related to interest-bearing liabilities remained
relatively flat. Interest expense on deposits decreased by $510
million or 6% but was offset by an increase of $503 million or
51% in interest expense related to obligations for securities sold
short and for securities sold under repurchase agreements.
Net interest rate margin
Net interest rate margin measures net interest income (TEB) as
a percentage of average earning assets. In 2001 our overall
margin increased 20 basis points to 1.83%. The increase can be
attributed to two factors:
•personal loan volumes. TD Canada Trust’s personal loan
volumes, excluding securitizations, increased by $3 billion
and its net interest margin improved by 4 basis points to
3.38%. In addition, TD Canada Trust’s results for fiscal 2001
include the full year impact of Canada Trust, compared with
nine months in fiscal 2000.
•growth in trading activities. An increased level of interest
income from trading activity at TD Securities resulted in an
increase in total net interest income. Changes in the
composition of trading securities can have an impact on net
interest income related to trading securities.
See supplementary information page 33, tables 4, 5, 6, 7
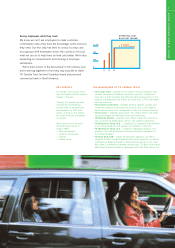
OTHER INCOME
Other income represents all of our income other than net
interest income. Sources of other income include revenues
from trading activities, brokerage fees, mutual fund
management fees, service fees, income from securitized
loans and other revenue.
See supplementary information page 34, tables 6 & 7
Reported other income was $6,447 million in 2001, an increase
of $47 million or .7% from 2000. After excluding investment
real estate gains, other income was $6,097 million for the year,
a decrease of $303 million or 5% from 2000. During the year, we
completed the sale of certain investment real estate assets for a
pre-tax gain, net of deferrals, of $350 million.
The decline in other income reflects a significant decrease in
self-directed brokerage revenues from TD Waterhouse of $519
million or 34%. This decrease reflects a 38% drop in average
trades per day to 116,000 from 188,000 a year ago.
TD Securities performed well, considering the challenging
capital markets environment. While trading income reported in
other income increased by only $93 million or 8% in 2001,
trading-related income in TD Securities (the total of trading
income reported in other income and the net interest income on
trading positions reported in net interest income) increased by
$599 million or 64% in 2001 to $1,537 million.
Underwriting fees increased by $59 million or 52% to $173
million. This increase reflected additional income from bond and
equity underwriting activities.
Offsetting the increases in trading income and underwriting
fees were declines in net investment securities gains and
corporate credit fees. Net investment securities gains decreased
by $166 million or 43% in 2001. The market value surplus over
book value of our equity investment securities portfolio was
$330 million compared to $736 million last year. Revenues
from corporate credit fees declined by $137 million or 32% in
2001, reflecting the slowing economy and a more difficult loan
syndications market.
Retail banking was a strong contributor to other income.
Insurance revenues reached $326 million, up $128 million or
65% from last year. Income from loan securitizations increased
by $36 million or 15%. Card services, retail credit fees and
service fees were up $159 million or 19%, reflecting growth in
business and a full year’s results for Canada Trust compared to
nine months for 2000.
Growth in assets under management at TD Wealth
Management contributed to an 11% increase in mutual fund
management fees, which reached $502 million, compared to
$452 million last year.
EXPENSES
Expenses include non-interest expenses, such as salaries,
occupancy and equipment costs, and other operating
expenses.
See supplementary information page 35, table 8
Reported expenses increased by $527 million or 6% to
$8,654 million in 2001. Total operating cash expenses
(excluding ongoing non-cash goodwill and purchase-related
intangible amortization and restructuring costs) increased by
$618 million or 10% to $6,925 million in 2001.
In fiscal 2001, the impact of non-cash goodwill and
purchase-related intangible amortization on our reported
expenses was $1,490 million, compared to $1,345 million a
year ago. The increase in 2001 reflects a full year of goodwill
and intangible amortization from the Canada Trust acquisition,
compared with nine months in 2000. On an after-tax basis,
however, the increase in goodwill and intangible amortization
was offset by future income tax benefits related to federal and
3
2
1
0
OTHER INCOME
(billions of dollars)
Trading income
Net investment
securities gains
Credit fees
Investment and
securities services
Other
97 98 99 00 01