Stein Mart 2015 Annual Report Download - page 17
Download and view the complete annual report
Please find page 17 of the 2015 Stein Mart annual report below. You can navigate through the pages in the report by either clicking on the pages listed below, or by using the keyword search tool below to find specific information within the annual report.-
 1
1 -
2
-
3
-
4
-
5
-
6
-
 7
7 -
 8
8 -
 9
9 -
 10
10 -
 11
11 -
 12
12 -
 13
13 -
 14
14 -
 15
15 -
 16
16 -
 17
17 -
 18
18 -
 19
19 -
 20
20 -
 21
21 -
 22
22 -
 23
23 -
 24
24 -
 25
25 -
 26
26 -
 27
27 -
28
-
29
-
30
-
31
-
32
-
33
-
34
-
35
-
36
-
37
-
38
-
39
-
40
-
41
-
42
-
43
-
44
-
45
-
46
-
47
-
48
-
49
-
50
-
51
-
52
 |
 |

15
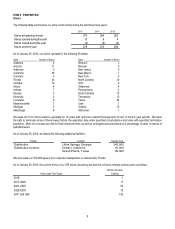
2014 Compared to 2013
Net Sales. The following table provides net sales for fiscal 2014 compared to fiscal 2013 (dollar amounts in thousands):
2014 2013 Increase
Net sales 1,317,677$ 1,263,571$ 54,106$
Sales percent increase:
Total net sales 4.3%
Comparable store sales 3.3%
The increase in comparable store sales was driven by increases in average units per transaction and average unit retail prices, partially
offset by a decrease in the number of transactions. Comparable store sales reflects stores open throughout the period and prior fiscal year
and includes internet sales. Internet sales contributed approximately 0.7% to the comparable store sales. Comparable store sales does
not include leased department commissions.
Gross Profit. The following table compares gross profit for fiscal 2014 to fiscal 2013 (dollar amounts in thousands):
2014 2013 Increase
Gross profit 386,736$ 367,353$ 19,383$
Percentage of net sales 29.3% 29.1% 0.2%
The gross profit rates increased primarily due to an approximate $5.0 million impact of the fourth quarter fiscal 2013 change in accounting
estimate for buying and distribution costs allocated to inventories as well as higher markup. These were somewhat offset by higher
occupancy costs, principally due to new stores and lower e-commerce margins which include third party fulfillment costs. The higher
occupancy costs include preopening costs.
Selling, General and Administrative Expenses. The following table compares SG&A for fiscal 2014 to fiscal 2013 (dollar amounts in
thousands):
2014 2013 Increase
Selling, general and administrative expenses 342,027$ 326,520$ 15,507$
Percentage of net sales 26.0% 25.9% 0.1%
SG&A increased $15.5 million primarily as the result of higher store selling expenses of $5.0 million due to new stores and planned payroll
increases, $4.3 million in higher healthcare costs due to unfavorable claims experience this year compared to favorable claims experience
last year, $2.5 million of higher advertising expenses and $2.1 million of higher expenses associated with the SEC investigation. These
increases were somewhat offset by lower earnings-based incentive compensation and higher credit card program income.
Income Taxes. The following table compares income tax expense for fiscal 2014 to fiscal 2013 (dollar amounts in thousands):
2014 2013 Increase
Income tax expense 17,537$ 15,013$ 2,524$
Effective tax rate ("ETR") 39.5% 37.0% 2.5%
The effective tax rate for 2014 was negatively impacted by permanent differences which relate primarily to non-recurring non-deductible
expenses. The effective tax rate for 2013 reflects a benefit for a change in our state tax effective rate.
Liquidity and Capital Resources
Capital requirements and working capital needs are funded through a combination of internally generated funds, available cash, credit
terms from vendors, and our Credit Facilities. See Note 4 of the Consolidated Financial Statements for further discussion of these facilities.
Working capital is used to support store inventories and capital investments for system improvements, new store openings and to maintain
existing stores. Historically, our investments in working capital are lowest in August and September, after our heavy spring selling season
and in February after the holiday selling season. Investments in working capital are highest in April, October and November as we begin
procuring and paying for merchandise to support our heavy spring and holiday seasons. As of January 30, 2016, we had cash and cash
equivalents of $11.8 million and $190.2 million in borrowings under our Credit Facilities. As of January 31, 2015, we had cash and cash
equivalents of $65.3 million and no borrowings. Our cash and cash equivalents decreased materially due to use of such cash to fund a
portion of the $5.00 per share special dividend paid in February 2015 and as a result we are now more reliant upon debt to fund our
working capital needs.