Southwest Airlines 2006 Annual Report Download - page 6
Download and view the complete annual report
Please find page 6 of the 2006 Southwest Airlines annual report below. You can navigate through the pages in the report by either clicking on the pages listed below, or by using the keyword search tool below to find specific information within the annual report.-
 1
1 -
 2
2 -
 3
3 -
 4
4 -
 5
5 -
 6
6 -
 7
7 -
 8
8 -
 9
9 -
 10
10 -
 11
11 -
 12
12 -
 13
13 -
 14
14 -
 15
15 -
 16
16 -
 17
17 -
18
-
19
-
20
-
21
-
22
-
23
-
24
-
25
-
26
-
27
-
28
-
29
-
30
-
31
-
32
-
33
-
34
-
35
-
36
-
37
-
38
-
39
-
40
-
41
-
42
-
43
-
44
-
45
-
46
-
47
-
48
-
49
-
50
-
51
-
52
-
53
-
54
-
55
-
56
-
57
-
58
-
59
-
60
-
61
-
62
-
63
-
64
-
65
-
66
-
67
-
68
-
69
-
70
-
71
-
72
-
73
-
74
-
75
-
76
-
77
-
78
-
79
-
80
-
81
-
82
-
83
 |
 |

S O U T H W E S T A I RL I N E S C O . A N N U A L R E P O R T 2 0 0 6
For 2006, Southwest posted its 34th consecutive year of profitability, which is a
record unmatched in the airline industry. Despite almost 50 percent higher jet fuel
prices versus 2005 and the adverse impact of the August 2006 London terrorist
plot and related carryon restrictions, our annual profits (economic) were up nearly
40 percent. Following what has been the most difficult five-year period in airline history,
the industry in 2006 reported its first collective operating profit since before the
events of September 11, 2001. In 2006, overall domestic seat capacity declined for the
first time since 2002. Through reorganizations both inside and outside of bankruptcy,
major carriers have reduced unprofitable capacity, and several smaller airlines have
ceased operations entirely.
As a result of the decline in unprofitable seat capacity in the U.S., the pricing
environment throughout much of 2006 was favorable. The industry steadily raised fares
throughout the year in an attempt to offset significantly higher fuel costs. Although
Southwest has the best fuel hedge program in the industry, we also faced significantly
higher fuel costs, with year-over-year jet fuel costs per gallon up almost 50 percent
versus 2005. Despite an $800 million increase in fuel costs, we significantly exceeded
our goal to increase economic earnings per diluted share by at least 15 percent with only
modest fare increases, due largely to the excellent cost-control efforts of our Employees.
The Company’s 2006 earnings growth represented an enormous accomplishment.
Coming into 2006, our goal of 15 percent earnings growth was one that few outside of
Southwest believed was possible to achieve. However, our People believed and, once
again, demonstrated that they are the best and will do whatever is necessary to stay on
top in the brutally competitive and difficult airline industry. Over the past five years, our
Employees have adapted to significant changes in airport security and continue to
innovate and implement the changes necessary to secure our future and protect our
Low-Cost Leadership. Although the legacy carriers have lowered their cost structures
through bankruptcy, furloughs, wage concessions, and other actions, their unit costs
(adjusted for stage length) remain substantially above ours, including and excluding fuel.
Our People have democratized the skies with low fares and understand low costs are
the key to our enduring success in the airline business and the only way we can provide
our Customers the Freedom to Fly.
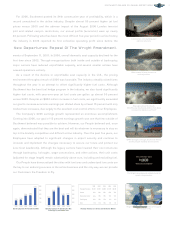
So go to SetLoveFree.com today and support
the Freedom to Fly.
The Wright Amendment is outdated, and its
repeal is long overdue.
GARY: Enough is enough. Southwest Airlines
and the people of Dallas deserve better.
Stop signs above the clouds.
VO: Why stop Southwest Airlines from ying
nonstop from Dallas Love Field?
Giant cranes lift new structure to
vertical position.
Construction crew building giant
unknown structure.
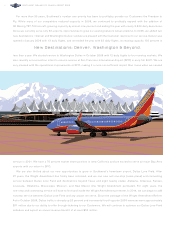
New Depart u r e s : R e p e a l O f T h e W r i g h t Amendmen t .
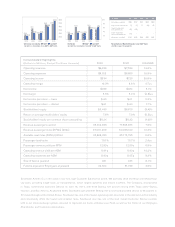
20062002 2003 2004 2005
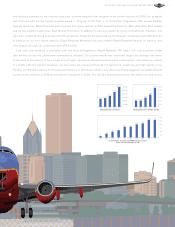
Operating Expenses Per Available Seat Mile
20062002 2003 2004 2005
Operating Expenses Per Available Seat Mile
Excluding Fuel and Related Taxes
Passenger Revenues (in millions) and Distribution Method
7.52¢ 7.74¢
7.97¢ 8.05¢
8.80¢
6.41¢
6.59¢
6.67¢
6.48¢ 6.49¢
9.0¢
8.6¢
8.2¢
7.8¢
7.4¢
6.7¢
6.6¢
6.5¢
6.4¢
6.3¢
$5,341 $5,741
20%
59%
$6,280
49% 54%
19% 18%
13%20% 16%
Passenger Revenues
Reservations Center
Internet
Travel Agency
10%
65%
$7,279
15%
11%
9%
70%
$8,750
12%
11%
7%11% 11%
Other
2002 2003 2004 2005 2006
5