Southwest Airlines 2003 Annual Report Download - page 14
Download and view the complete annual report
Please find page 14 of the 2003 Southwest Airlines annual report below. You can navigate through the pages in the report by either clicking on the pages listed below, or by using the keyword search tool below to find specific information within the annual report.-
 1
1 -
2
-
3
-
 4
4 -
 5
5 -
 6
6 -
 7
7 -
 8
8 -
 9
9 -
 10
10 -
 11
11 -
 12
12 -
 13
13 -
 14
14 -
 15
15 -
 16
16 -
 17
17 -
 18
18 -
 19
19 -
 20
20 -
 21
21 -
 22
22 -
 23
23 -
 24
24 -
25
-
26
-
27
-
28
-
29
-
30
-
31
-
32
-
33
-
34
-
35
-
36
-
37
-
38
-
39
-
40
-
41
-
42
-
43
-
44
-
45
-
46
-
47
-
48
-
49
-
50
-
51
-
52
-
53
-
54
-
55
-
56
-
57
-
58
-
59
-
60
-
61
-
62
-
63
-
64
-
65
-
66
-
67
-
68
-
69
-
70
-
71
-
72
-
73
-
74
-
75
-
76
 |
 |

13
Southwest Airlines Co. 2003 Annual Report
COMMON STOCK PRICE RANGES AND DIVIDENDS
Southwest’s common stock is listed on the New York Stock Exchange and is traded under the symbol LUV. The high and low sales prices of the common
stock on the Composite Tape and the quarterly dividends per share were:
PERIOD DIVIDENDS HIGH LOW
2003
1st Quarter $.0045 $15.33 $11.72
2nd Quarter .0045 17.70 14.09
3rd Quarter .0045 18.99 15.86
4th Quarter .0045 19.69 15.30
2002
1st Quarter $.0045 $22.00 $17.17
2nd Quarter .0045 19.35 14.85
3rd Quarter .0045 16.08 10.90
4th Quarter .0045 16.70 11.23
QUARTERLY FINANCIAL DATA (UNAUDITED)
THREE MONTHS ENDED
(In millions, except per share amounts) MARCH 31 JUNE 30 SEPTEMBER 30 DECEMBER 31
2003
Operating revenues $1,351 $1,515 $1,553 $1,517
Operating income 46 140 185 111
Income before income taxes 39 397 171 101
Net income 24 246 106 66
Net income per share, basic .03 .32 .14 .08
Net income per share, diluted .03 .30 .13 .08
2002
Operating revenues $1,257 $1,473 $1,391 $1,401
Operating income 49 189 91 88
Income before income taxes 35 169 124 64
Net income 21 102 75 42
Net income per share, basic .03 .13 .10 .05
Net income per share, diluted .03 .13 .09 .05
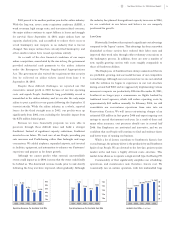
1999 2000 2001 2002
Operating Revenue (in millions)
$4,736
$5,650 $5,555 $5,522
2003
$5,937 $6,000
$5,000
$4,000
$3,000
$2,000
$1,000
1999 2000 2001 2002
Passenger Load Factor
69.0% 70.5% 68.1% 65.9%
2003
66.8%
75%
70%
65%
60%
55%
50%
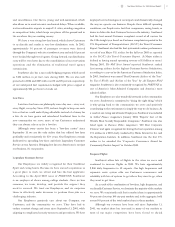
50
40
30
20
10
1999 2000 2001 2002
36,479
42,215 44,494 45,392
2003
47,943
Revenue Passenger Miles (in millions)