Southwest Airlines 2000 Annual Report Download - page 2
Download and view the complete annual report
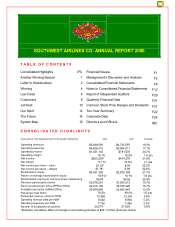
Please find page 2 of the 2000 Southwest Airlines annual report below. You can navigate through the pages in the report by either clicking on the pages listed below, or by using the keyword search tool below to find specific information within the annual report.-
 1
1 -
 2
2 -
 3
3 -
 4
4 -
 5
5 -
 6
6 -
 7
7 -
 8
8 -
 9
9 -
 10
10 -
 11
11 -
 12
12 -
 13
13 -
14
-
15
-
16
-
17
-
18
-
19
-
20
-
21
-
22
-
23
-
24
-
25
-
26
-
27
-
28
-
29
-
30
-
31
-
32
-
33
-
34
-
35
-
36
-
37
-
38
-
39
-
40
-
41
-
42
-
43
 |
 |

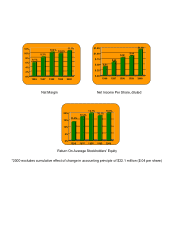
Net Margin Net Income Per Share, diluted
Return On Average Stockholders’ Equity
6.1%
8.3%
10.4% 10.0%
11.1%
0%
2%
4%
6%
8%
10%
12%
1996 1997 1998 1999 2000
$.41
$.62
$.82 $.89
$1.18
$.00
$.25
$.50
$.75
$1.00
$1.25
1996 1997 1998 1999 2000
13.5%
17.4%
19.7%
18.1%
19.9%
0%
5%
10%
15%
20%
1996 1997 1998 1999 2000
*2000 excludes cumulative effect of change in accounting principle of $22.1 million ($.04 per share)