Southwest Airlines 1998 Annual Report Download - page 1
Download and view the complete annual report
Please find page 1 of the 1998 Southwest Airlines annual report below. You can navigate through the pages in the report by either clicking on the pages listed below, or by using the keyword search tool below to find specific information within the annual report.-
 1
1 -
 2
2 -
 3
3 -
 4
4 -
 5
5 -
 6
6 -
 7
7 -
 8
8 -
 9
9 -
 10
10 -
 11
11 -
 12
12 -
13
-
14
-
15
-
16
-
17
-
18
-
19
-
20
-
21
-
22
-
23
-
24
-
25
-
26
-
27
-
28
-
29
-
30
-
31
-
32
-
33
-
34
-
35
-
36
-
37
-
38
-
39
-
40
-
41
-
42
-
43
-
44
-
45
-
46
-
47
-
48
-
49
-
50
-
51
-
52
-
53
-
54
-
55
-
56
-
57
-
58
-
59
-
60
-
61
-
62
-
63
-
64
-
65
-
66
-
67
-
68
-
69
 |
 |

1
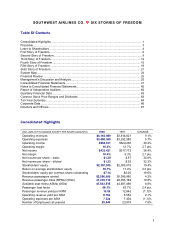
SOUTHWEST AIRLINES CO. ¤ SIX STORIES OF FREEDOM
Table Of Contents
Consolidated Highlights .............................................................................................................. 1
Preamble.................................................................................................................................... 3
Letter to Shareholders ................................................................................................................ 4
First Story of Freedom................................................................................................................ 6
Second Story of Freedom........................................................................................................... 9
Third Story of Freedom............................................................................................................. 12
Fourth Story of Freedom........................................................................................................... 15
Fifth Story of Freedom.............................................................................................................. 18
Sixth Story of Freedom............................................................................................................. 21
System Map ............................................................................................................................. 24
Financial Review ...................................................................................................................... 25
Management’s Discussion and Analysis.................................................................................... 25
Consolidated Financial Statements........................................................................................... 41
Notes to Consolidated Financial Statements............................................................................. 45
Report of Independent Auditors ................................................................................................ 62
Quarterly Financial Data ........................................................................................................... 63
Common Stock Price Ranges and Dividends............................................................................ 63
Ten-Year Summary .................................................................................................................. 64
Corporate Data ......................................................................................................................... 66
Directors and Officers............................................................................................................... 67
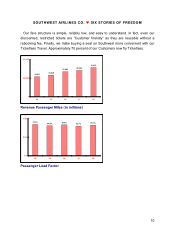
Consolidated Highlights
(DOLLARS IN THOUSANDS EXCEPT PER SHARE AMOUNTS) 1998 1997 CHANGE
Operating revenues $4,163,980 $3,816,821 9.1%
Operating expenses $3,480,369 $3,292,585 5.7%
Operating income $683,611 $524,236 30.4%
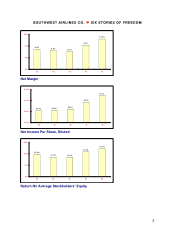
Operating margin 16.4% 13.7% 2.7 pts.
Net income $433,431 $317,772 36.4%
Net margin 10.4% 8.3% 2.1 pts.
Net income per share – basic $1.30 $.97 34.0%
Net income per share – diluted $1.23 $.93 32.3%
Stockholders’ equity $2,397,918 $2,009,018 19.4%
Return on average stockholders’ equity 19.7% 17.4% 2.3 pts.
Stockholders’ equity per common share outstanding $7.14 $6.05 18.0%
Revenue passengers carried 52,586,400 50,399,960 4.3%
Revenue passenger miles (RPMs) (000s) 31,419,110 28,355,169 10.8%
Available seat miles (ASMs) (000s) 47,543,515 44,487,496 6.9%
Passenger load factor 66.1% 63.7% 2.4 pts.
Passenger revenue yield per RPM 12.62 12.84¢ (1.7)%
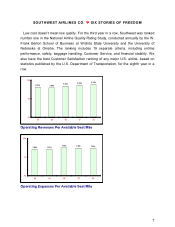
Operating revenue yield per ASM 8.76¢ 8.58¢ 2.1%
Operating expenses per ASM 7.32¢ 7.40¢ (1.1)%
Number of Employees at yearend 25,844 23,974 7.8%