Sonic 2001 Annual Report Download - page 2
Download and view the complete annual report
Please find page 2 of the 2001 Sonic annual report below. You can navigate through the pages in the report by either clicking on the pages listed below, or by using the keyword search tool below to find specific information within the annual report.-
 1
1 -
 2
2 -
 3
3 -
 4
4 -
 5
5 -
 6
6 -
 7
7 -
 8
8 -
 9
9 -
 10
10 -
 11
11 -
 12
12 -
 13
13 -
14
-
15
-
16
-
17
-
18
-
19
-
20
-
21
-
22
-
23
-
24
 |
 |

THE DAILY CRUISER PAGE 2
which are the cornerstones of the Sonic brand - unique, made-to-order
menu items and great carhop service, combined in a drive-in setting that
is as much fun as it is efficient. It’s our unwavering commitment to these
brand treasures, and the high level of quality and service that underscore
them, that makes Sonic a favorite and frequent stop for so many people.
We can trace Sonic’s prosperity to other catalysts as well, most notably
our multi-layered growth strategies that build on and extend our brand
in a number of ways to sustain industry-leading results. These strategies
are grounded in Sonic’s initial orientation as a
franchising organization. Considering that
more than 80% of our drive-ins are operated by
franchisees under ascending royalty rate agree-
ments, which is uncommon in the restaurant
industry, our strong drive-in expansion pro-
gram provides a significant, reliable and increas-
ing base of franchising income to complement
our now-substantial company operations. Add
to this our increasing commitment to marketing
support for our brand and a steady stream of
new product news to surprise and delight our
customers, and you can begin to appreciate how
Sonic also continues to drive higher average
unit volume and system-wide same-store sales.
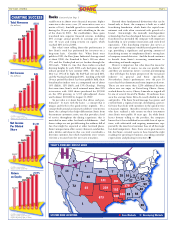
In terms of drive-in development, fiscal
2001 was another record year for us as we
added a total of 191 new restaurants to the chain, topping the previous
record of 174 last year. With these openings, we ended the year with
2,359 drive-in restaurants in operation across 29 states and one new
drive-in opened in Mexico by one of our long-standing franchisees.
Importantly, our drive-in development is led by franchisees, who added
157 new restaurants in 2001, up from 150 in 2000. We think this record
pace will likely continue as we target a total of 190 to 200 new franchisee
and company drive-in openings next year. This momentum enhances
the outlook in fiscal 2002 for sustained growth in revenues from an
expanding base of company-owned and franchised drive-ins.
As with any consumer product, and perhaps especially important in
the restaurant industry, strong advertising and marketing support is
essential to achieve the top-of-mind brand awareness that is crucial to
sales growth. At Sonic, we have increased our marketing expenditures
an average of 23% over the past five years, topping $80 million in 2001.
More important, we continue to explore new and effective ways to
deploy those resources. For instance, during the past year we established
an exclusive sponsorship with NASCAR Winston Cup Driver and Busch
Series Driver Kevin Harvick and the Richard Childress Racing Team
and, more recently, signed on as a sponsor of NCAA college football on
CBS. Both of these initiatives have produced strong early results for us,
taking our brand message to viewers who typically have a high frequency
of fast-food dining. The outlook for next year is just as strong consider-
ing our plans to boost marketing expenditures to more than $90 million.
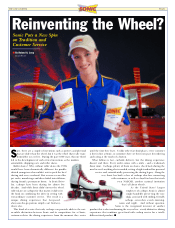
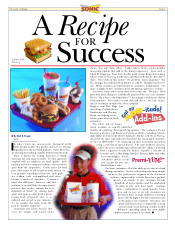
When customers arrive at our drive-ins, they find plenty to like about
Sonic - from old favorites to fresh taste sensations that are destined to
become new favorites. During fiscal 2001, we implemented a new menu
to make our signature Toaster®Sandwiches and Cream Pie Shakes a per-
manent part of our offerings to go with our
classics like Coneys and Tater Tots. We also
continued to enhance our menu with a
constant flow of new drink and sandwich
ideas, coupled with our promotions for
Premi-Yum!™ Shakes and our invitation for
customers to develop an ADD-itude™ by
experimenting with special drink flavors
and sandwich condiments.
With an increasing marketing budget,
strong new product news, and an emphasis
on food quality, we witnessed the continu-
ation of some very positive trends last year.
After some very difficult winter months with
the coldest weather on record in many of our
markets, Sonic’s same-store sales during the
last half of the year increased 4.9% - our best
results since the fall of 1999. For all of 2001, same-store sales rose 1.8%,
the fifteenth consecutive year of such gains and a truly phenomenal
accomplishment in our industry. Likewise, system-wide average unit
volumes increased 2.5% during the year.
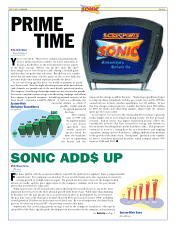
Sonic today is a highly differentiated, $2 billion brand, one that took
some 44 years to reach the $1 billion mark and only four more years to
double. When you consider the power of our brand, the proven success
of our multi-layered growth strategies, and the increasing operating
leverage that comes with an expanding chain, it’s easy to get excited
about Sonic’s future. The opportunities for continued expansion across
our markets remain abundant, even in our core states. Moreover, new
product news and expanded day part initiatives, such as the ongoing
rollout of our breakfast menu and other initiatives, should continue to
WOW our customers. With these things in mind, we remain enthusiastic
about the prospects of another record year in the making for fiscal 2002.
While it is difficult to assess the lasting impact of the tragic events in
September on consumer confidence and behavior, we believe our proven
growth strategies will continue to drive the company’s sales and earnings
to new levels in the coming year. ■
Booms Continued from Page 1
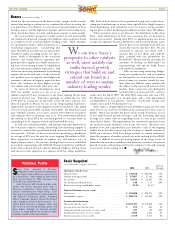
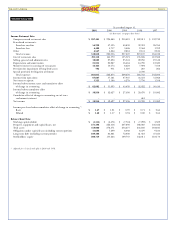
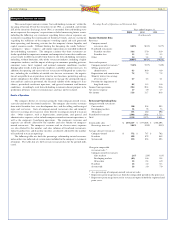
Sonic Snapshot
($ in thousands, except per share data) Percent
2001
2000 Change
Operations (for the year)
Total revenues. . . . . . . . . . . . . . . . . . . . . . . . . . . . . . . . . . . . . . . .
$ 330,638
$ 280,056 18%
Income from operations . . . . . . . . . . . . . . . . . . . . . . . . . . . . . . . .
$ 67,607
$ 57,181 18%
Net income . . . . . . . . . . . . . . . . . . . . . . . . . . . . . . . . . . . . . . . . . .
$ 38,956
$ 32,627 19%
Net income per diluted share . . . . . . . . . . . . . . . . . . . . . . . . . . . .
$ 1.40
$ 1.17 20%
Return on average stockholders’ equity . . . . . . . . . . . . . . . . . . . . .
21.9%
21.4%
Financial Position (at year’s end)
Total assets . . . . . . . . . . . . . . . . . . . . . . . . . . . . . . . . . . . . . . . . . .
$ 358,000
$ 278,371 29%
Stockholders’ equity . . . . . . . . . . . . . . . . . . . . . . . . . . . . . . . . . . .
$ 200,719
$ 155,263 29%
System-wide Information
Total sales (for the year) . . . . . . . . . . . . . . . . . . . . . . . . . . . . . . . .
$1,971,477
$ 1,778,828 11%
Average unit sales (for the year) . . . . . . . . . . . . . . . . . . . . . . . . . .
$ 874
$ 853 2%
Company-owned restaurants (at year’s end) . . . . . . . . . . . . . . . . .
393
312 26%
Franchised restaurants (at year’s end) . . . . . . . . . . . . . . . . . . . . . .
1,966
1,863 6%
Total restaurants (at year’s end) . . . . . . . . . . . . . . . . . . . . . . . . . . .
2,359
2,175 8%
We can trace Sonic’s
prosperity to other catalysts
as well, most notably our
multi-layered growth
strategies that build on and
extend our brand in a
number of ways to sustain
industry-leading results.
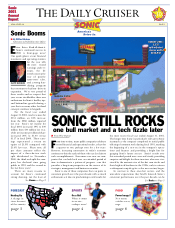
S
onic Corp., founded in Shawnee,
Oklahoma in 1953, franchises and operates
the largest chain of drive-in restaurants in
the United States. Sonic ended the most recent
fiscal year on August 31, 2001, with more than
2,350 drive-ins across 29 states.
Sonic Drive-Ins offer made-to-order sand-
wiches and feature signature items such as
Toaster®Sandwiches, Extra-Long Cheese
Coneys, hand-battered Onion Rings, Tater
Tots, and a variety of Frozen Favorites®desserts
and Fountain Favorites®drinks, including
Cherry Limeades, Slushes, Cream Pie Shakes,
and a complete soft-serve dessert menu. At a
typical Sonic Drive-In, customers drive into
one of 24 to 36 covered parking spaces and
place orders through an intercom speaker
system. A carhop delivers the customer’s order
curbside, usually within four minutes.
Publisher Profile