Sonic 2001 Annual Report Download - page 10
Download and view the complete annual report
Please find page 10 of the 2001 Sonic annual report below. You can navigate through the pages in the report by either clicking on the pages listed below, or by using the keyword search tool below to find specific information within the annual report.-
 1
1 -
 2
2 -
 3
3 -
 4
4 -
 5
5 -
 6
6 -
 7
7 -
 8
8 -
 9
9 -
 10
10 -
 11
11 -
 12
12 -
 13
13 -
 14
14 -
 15
15 -
 16
16 -
 17
17 -
 18
18 -
 19
19 -
 20
20 -
 21
21 -
22
-
23
-
24
 |
 |

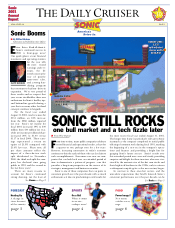
THE DAILY CRUISER PAGE 10
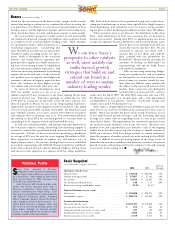
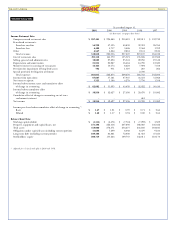
Selected Financial Data
Year ended August 31,
2001 2000 1999 1998 1997
(In thousands, except per share data)
Income Statement Data:
Company-owned restaurant sales $ 267,463 $ 224,880 $ 210,419 $ 182,011 $ 152,739
Franchised restaurants:
Franchise royalties 54,220 47,595 40,859 32,391 26,764
Franchise fees 4,408 3,717 3,468 2,564 1,702
Other 4,547 3,864 2,861 2,141 2,813
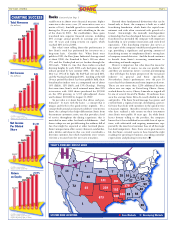
Total revenues 330,638 280,056 257,607 219,107 184,018
Cost of restaurant sales 195,338 163,570 155,521 135,806 112,588
Selling, general and administrative 30,602 27,894 25,543 22,250 19,318
Depreciation and amortization 23,855 20,287 18,464 14,790 12,320
Minority interest in earnings of restaurants 12,444 10,173 8,623 7,904 7,558
Provision for impairment of long-lived assets 792 951 1,519 285 266
Special provision for litigation settlement -- - 2,700 -
Total expenses 263,031 222,875 209,670 183,735 152,050
Income from operations 67,607 57,181 47,937 35,372 31,968
Net interest expense 5,525 5,186 4,278 2,750 1,558
Income before income taxes and cumulative effect
of change in accounting $ 62,082 $ 51,995 $ 43,659 $ 32,622 $ 30,410
Income before cumulative effect
of change in accounting $ 38,956 $ 32,627 $ 27,396 $ 20,470 $ 19,082
Cumulative effect of change in accounting, net of taxes
and minority interest -- - 681 -
Net income $ 38,956 $ 32,627 $ 27,396 $ 19,789 $ 19,082
Income per share before cumulative effect of change in accounting
(1)
:
Basic $ 1.47 $ 1.21 $ 0.97 $ 0.71 $ 0.64
Diluted $ 1.40 $ 1.17 $ 0.94 $ 0.69 $ 0.63
Balance Sheet Data:
Working capital (deficit) $ (3,335) $ (6,371) $ (7,743) $ (7,292) $ 3,509
Property, equipment and capital leases, net 273,198 222,318 207,890 188,065 136,522
Total assets 358,000 278,371 256,677 233,180 184,841
Obligations under capital leases (including current portion) 13,688 7,299 8,048 8,379 9,183
Long-term debt (including current portion) 109,168 83,881 72,400 61,518 37,633
Stockholders’ equity 200,719 155,263 149,755 132,011 118,174
(1) Adjusted for a 3-for-2 stock split in 2000 and 1998.