Sonic 2001 Annual Report Download - page 15
Download and view the complete annual report
Please find page 15 of the 2001 Sonic annual report below. You can navigate through the pages in the report by either clicking on the pages listed below, or by using the keyword search tool below to find specific information within the annual report.-
 1
1 -
2
-
3
-
4
-
 5
5 -
 6
6 -
 7
7 -
 8
8 -
 9
9 -
 10
10 -
 11
11 -
 12
12 -
 13
13 -
 14
14 -
 15
15 -
 16
16 -
 17
17 -
 18
18 -
 19
19 -
 20
20 -
 21
21 -
 22
22 -
 23
23 -
 24
24
 |
 |

THE DAILY CRUISER PAGE 15
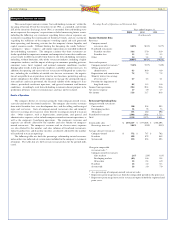
Consolidated Statements of Stockholders’ Equity
Common Stock Paid-in Retained Treasury Stock
Shares Amount Capital Earnings Shares Amount
(In thousands)
Balance at August 31, 1998 20,554 $ 206 $ 63,866 $ 89,455 1,692 $ (21,516)
Exercise of common stock options 192 1 2,367 – – –
Tax benefit related to exercise of employee stock options – – 979 – – –
Purchase of treasury stock – – – – 472 (12,999)
Net income – – – 27,396 – –
Balance at August 31, 1999 20,746 207 67,212 116,851 2,164 (34,515)
Exercise of common stock options 137 2 1,911 – – –
Tax benefit related to exercise of employee stock options – – 767 – – –
Purchase of treasury stock – – – – 1,138 (29,799)
Three-for-two stock split 10,442 104 (104) – 1,651 –
Net income – – – 32,627 – –
Balance at August 31, 2000 31,325 313 69,786 149,478 4,953 (64,314)
Exercise of common stock options
589 6 5,827 – – –
Tax benefit related to exercise of employee stock options
– – 2,814 – – –
Purchase of treasury stock
– – – – 76 (2,147)
Net income
– – – 38,956 – –
Balance at August 31, 2001 31,914 $ 319 $ 78,427 $ 188,434 5,029 $ (66,461)
See accompanying notes.
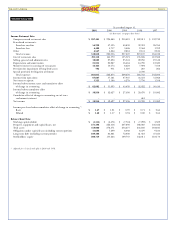
Consolidated Statements of Income
Year ended August 31,
2001 2000 1999
(In thousands, except per share data)
Revenues:
Company-owned restaurant sales $ 267,463 $ 224,880 $ 210,419
Franchised restaurants:
Franchise royalties 54,220 47,595 40,859
Franchise fees 4,408 3,717 3,468
Other 4,547 3,864 2,861
330,638 280,056 257,607
Costs and expenses:
Company-owned restaurants:
Food and packaging 69,609 58,778 56,048
Payroll and other employee benefits 75,822 62,576 59,490
Other operating expenses 49,907 42,216 39,983
195,338 163,570 155,521
Selling, general and administrative 30,602 27,894 25,543
Depreciation and amortization 23,855 20,287 18,464
Minority interest in earnings of restaurants 12,444 10,173 8,623
Provision for impairment of long-lived assets and other 792 951 1,519
263,031 222,875 209,670
Income from operations 67,607 57,181 47,937
Interest expense 6,628 6,234 5,047
Interest income (1,103) (1,048) (769)
Net interest expense 5,525 5,186 4,278
Income before income taxes 62,082 51,995 43,659
Provision for income taxes 23,126 19,368 16,263
Net income $ 38,956 $ 32,627 $ 27,396
Basic income per share $ 1.47 $ 1.21 $ .97
Diluted income per share $ 1.40 $ 1.17 $ .94
See accompanying notes.