Sara Lee 2009 Annual Report Download - page 86
Download and view the complete annual report
Please find page 86 of the 2009 Sara Lee annual report below. You can navigate through the pages in the report by either clicking on the pages listed below, or by using the keyword search tool below to find specific information within the annual report.-
 1
1 -
2
-
3
-
4
-
5
-
6
-
7
-
8
-
9
-
10
-
11
-
12
-
13
-
14
-
15
-
16
-
17
-
18
-
19
-
20
-
21
-
22
-
23
-
24
-
25
-
26
-
27
-
28
-
29
-
30
-
31
-
32
-
33
-
34
-
35
-
36
-
37
-
38
-
39
-
40
-
41
-
42
-
43
-
44
-
45
-
46
-
47
-
48
-
49
-
50
-
51
-
52
-
53
-
54
-
55
-
56
-
57
-
58
-
59
-
60
-
61
-
62
-
63
-
64
-
65
-
66
-
67
-
68
-
69
-
70
-
71
-
72
-
73
-
74
-
75
-
 76
76 -
 77
77 -
 78
78 -
 79
79 -
 80
80 -
 81
81 -
 82
82 -
 83
83 -
 84
84 -
 85
85 -
 86
86 -
 87
87 -
 88
88 -
 89
89 -
 90
90 -
 91
91 -
 92
92
 |
 |

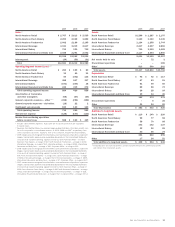
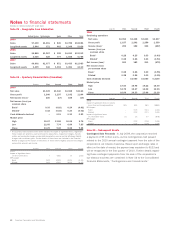
Notes to financial statements
Dollars in millions except per share data
84 Sara Lee Corporation and Subsidiaries
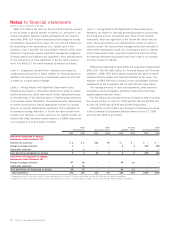
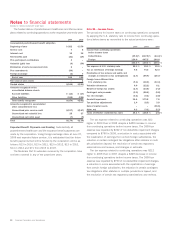
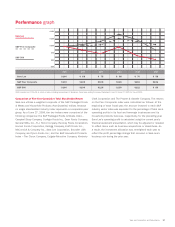
Note 23 – Geographic Area Information
United States Netherlands Spain Other Total
2009
Sales $7,100 $1,151 $÷«845 $3,785 $12,881
Long-lived assets 2,844 371 463 1,348 5,026
2008
Sales $6,860 $1,267 $÷«995 $4,090 $13,212
Long-lived assets 3,026 428 777 1,555 5,786
2007
Sales $6,602 $1,077 $÷«871 $3,433 $11,983
Long-lived assets 3,409 346 1,004 1,351 6,110
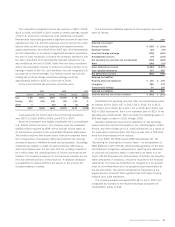
Note 24 – Quarterly Financial Data (Unaudited)
Quarter First Second Third Fourth
2009
Net sales $3,349 $3,340 $3,028 $3,164
Gross profit 1,240 1,197 1,142 1,204
Net income (loss)1230 (17) 165 (14)
Net income (loss) per
common share
Basic10.33 (0.02) 0.24 (0.02)
Diluted10.32 (0.02) 0.24 (0.02)
Cash dividends declared – 0.11 0.11 0.22
Market price
High 15.07 13.55 10.64 9.75
Low 12.05 7.74 6.80 7.85
Close 13.29 9.42 8.25 9.58
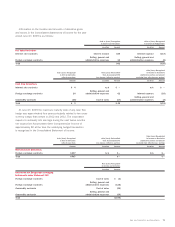
1The quarterly financial data shown above includes the impact of significant items. Significant
items include exit activities, asset and business dispositions, impairment charges, transfor-
mation and accelerate charges, accelerated depreciation, pension partial withdrawal liability
charges and curtailment gains. Further details of these items are included in the Financial
Review on page 18. The impact of these items is shown where negative amounts are charges
and positive amounts are income.
Quarter First Second Third Fourth
2009
Impact of significant items
on net income (loss) 7 (161) (7) (213)
EPS impact
Basic 0.02 (0.23) (0.01) (0.31)
Diluted 0.01 (0.23) (0.01) (0.31)
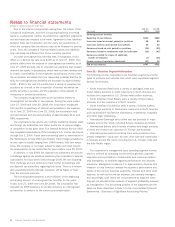
Quarter First Second Third Fourth
2008
Continuing operations
Net sales $3,054 $3,408 $3,243 $3,507
Gross profit 1,157 1,292 1,259 1,350
Income (loss)1200 182 234 (657)
Income (loss) per
common share
Basic10.28 0.25 0.33 (0.93)
Diluted10.28 0.25 0.33 (0.93)
Net income (loss)1200 182 211 (672)
Net income (loss)
per common share
Basic10.28 0.25 0.30 (0.95)
Diluted10.28 0.25 0.30 (0.95)
Cash dividends declared – 0.1050 0.1050 0.2100
Market price
High 17.54 16.95 16.22 15.00
Low 14.75 15.67 12.32 12.15
Close 16.69 16.23 13.66 12.18
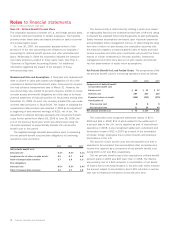
Quarter First Second Third Fourth
2008
Impact of significant items on income
(loss) from continuing operations $(1) $24 $81 $(863)
EPS impact
Basic – 0.03 0.11 (1.22)
Diluted – 0.03 0.11 (1.22)
Impact of significant items
on net income (loss) (1) 23 57 (878)
EPS impact
Basic – 0.03 0.08 (1.24)
Diluted – 0.03 0.08 (1.24)
Note 25 – Subsequent Events
Contingent Sale Proceeds In July 2009, the corporation received
a payment of 95 million euros, as the contingencies had passed
related to the 2010 annual contingent payment from the sale of the
corporation’s cut tobacco business. Based upon exchange rates in
effect on the date of receipt, the payment was equivalent to $133 and
will be recognized in the first quarter of 2010. Further details regard-
ing these contingent payments from the sale of the corporation’s
cut tobacco business are contained in Note 16 to the Consolidated
Financial Statements, “Contingencies and Commitments.”