Sara Lee 2009 Annual Report Download - page 65
Download and view the complete annual report
Please find page 65 of the 2009 Sara Lee annual report below. You can navigate through the pages in the report by either clicking on the pages listed below, or by using the keyword search tool below to find specific information within the annual report.-
 1
1 -
2
-
3
-
4
-
5
-
6
-
7
-
8
-
9
-
10
-
11
-
12
-
13
-
14
-
15
-
16
-
17
-
18
-
19
-
20
-
21
-
22
-
23
-
24
-
25
-
26
-
27
-
28
-
29
-
30
-
31
-
32
-
33
-
34
-
35
-
36
-
37
-
38
-
39
-
40
-
41
-
42
-
43
-
44
-
45
-
46
-
47
-
48
-
49
-
50
-
51
-
52
-
53
-
54
-
 55
55 -
 56
56 -
 57
57 -
 58
58 -
 59
59 -
 60
60 -
 61
61 -
 62
62 -
 63
63 -
 64
64 -
 65
65 -
 66
66 -
 67
67 -
 68
68 -
 69
69 -
 70
70 -
 71
71 -
 72
72 -
 73
73 -
 74
74 -
 75
75 -
76
-
77
-
78
-
79
-
80
-
81
-
82
-
83
-
84
-
85
-
86
-
87
-
88
-
89
-
90
-
91
-
92
 |
 |

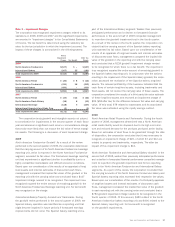
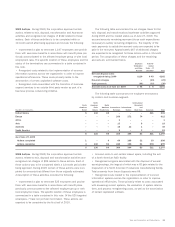
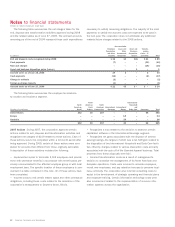
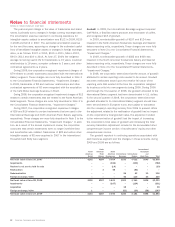
The following table summarizes the net charges taken for the
exit, disposal and transformation activities approved during 2007
and the related status as of June 27, 2009. The accrued amounts
remaining as of the end of 2009 represent those cash expenditures
necessary to satisfy remaining obligations. The majority of the cash
payments to satisfy the accrued costs are expected to be paid in
the next year. The corporation does not anticipate any additional
material future charges related to the 2007 actions.
Sara Lee Corporation and Subsidiaries 63
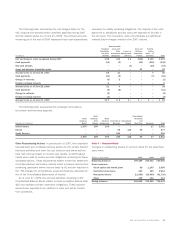
Non-cancelable
Employee Lease and Asset and Transfor-
Termination Other Losses on Business mation
and Other Contractual Abandonment Disposition Costs – IT
In millions Benefits Obligations of Assets Actions and Other Total
Exit and disposal costs recognized during 2007 $«98 $13 $«1 $(12) $«119 $«219
Cash payments (30) (2) – (11) (100) (143)
Non-cash charges – – (1) – (12) (13)
Asset and business disposition gains –––23–23
Accrued costs as of June 30, 2007 68 11 «– «««– «««««7 «««86
Cash payments (40) (9) – – (7) (56)
Change in estimate (3)2–––(1)
Foreign exchange impacts 6––––6
Accrued costs as of June 28, 2008 314–––35
Cash payments (9) (2) – – – (11)
Change in estimate (2)––––(2)
Foreign exchange impacts (3)––––(3)
Accrued costs as of June 27, 2009 $«17 $««2 $«– $«««– $«««««– $«««19
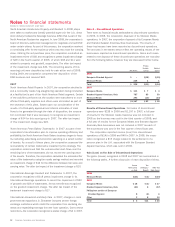
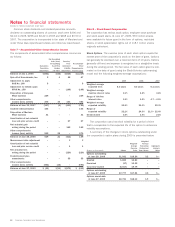
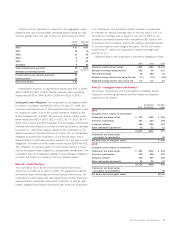
The following table summarizes the employee terminations
by location and business segment.
North International
North American North Household
American Fresh American International International and
Number of employees Retail Bakery Foodservice Beverage Bakery Body Care Corporate Total
United States 1,576259199–––172,051
Europe – – – 65 118 94 – 277
South America –––184–––184
1,576 259 199 249 118 94 17 2,512
Other Restructuring Actions In periods prior to 2007, the corporation
had approved and completed various actions to exit certain defined
business activities and lower its cost structure and these actions
have had minimal impact on current year results. In 2009 adjust-
ments were made to certain accrued obligations remaining for these
completed actions. These adjustments related to the final settlement
of certain planned termination actions which increased income from
continuing operations before income taxes by $1 and are reported in
the “Net charges for exit activities, asset and business dispositions”
line of the Consolidated Statements of Income.
As of June 27, 2009, the accrued liabilities remaining in the
Consolidated Balance Sheet related to these completed actions total
$25 and represent certain severance obligations. These accrued
amounts are expected to be satisfied in cash and will be funded
from operations.
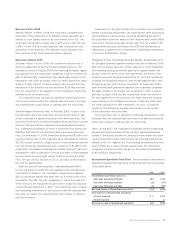
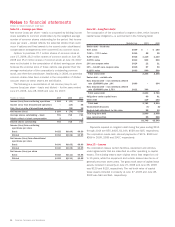
Note 6 – Common Stock
Changes in outstanding shares of common stock for the past three
years were:
Shares in thousands 2009 2008 2007
Beginning balances 706,359 724,433 760,980
Stock issuances
Stock option and benefit plans 38 1,163 2,556
Restricted stock plans 543 320 2,514
Reacquired shares (11,390) (19,669) (41,730)
Other 108 112 113
Ending balances 695,658 706,359 724,433