Sara Lee 2009 Annual Report Download - page 28
Download and view the complete annual report
Please find page 28 of the 2009 Sara Lee annual report below. You can navigate through the pages in the report by either clicking on the pages listed below, or by using the keyword search tool below to find specific information within the annual report.-
 1
1 -
2
-
3
-
4
-
5
-
6
-
7
-
8
-
9
-
10
-
11
-
12
-
13
-
14
-
15
-
16
-
17
-
 18
18 -
 19
19 -
 20
20 -
 21
21 -
 22
22 -
 23
23 -
 24
24 -
 25
25 -
 26
26 -
 27
27 -
 28
28 -
 29
29 -
 30
30 -
 31
31 -
 32
32 -
 33
33 -
 34
34 -
 35
35 -
 36
36 -
 37
37 -
 38
38 -
39
-
40
-
41
-
42
-
43
-
44
-
45
-
46
-
47
-
48
-
49
-
50
-
51
-
52
-
53
-
54
-
55
-
56
-
57
-
58
-
59
-
60
-
61
-
62
-
63
-
64
-
65
-
66
-
67
-
68
-
69
-
70
-
71
-
72
-
73
-
74
-
75
-
76
-
77
-
78
-
79
-
80
-
81
-
82
-
83
-
84
-
85
-
86
-
87
-
88
-
89
-
90
-
91
-
92
 |
 |

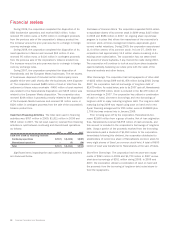
Financial review
26 Sara Lee Corporation and Subsidiaries
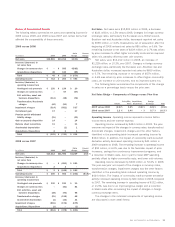
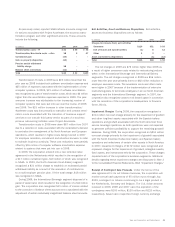
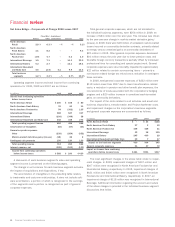
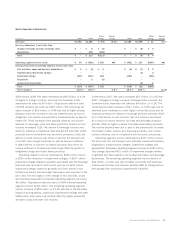
Net Sales Bridge – Components of Change 2008 versus 2007
Price/Mix/ Acquisitions/
Volume Other Dispositions Currency Total
North American
Retail 2.8 % 0.3 % –% –% 3.1%
North American
Fresh Bakery 1.1 8.2 ––9.3
North American
Foodservice (3.9) 4.7 –0.2 1.0
International Beverage 1.5 7.1 –14.3 22.9
International Bakery 0.3 2.7 –13.1 16.1
International Household
and Body Care 4.6 (2.4) 0.1 9.9 12.2
Total business
segments 1.2 % 3.4 % –% 5.7% 10.3%
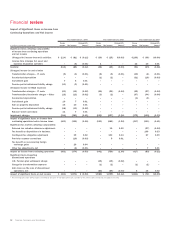
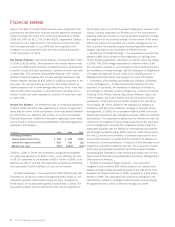
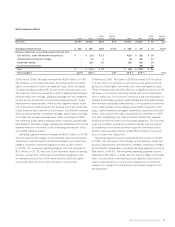
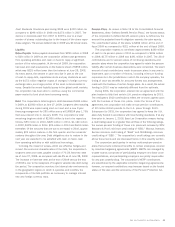
Operating segment income and total income from continuing
operations for 2009, 2008 and 2007 are as follows:
In millions 2009 2008 2007
Income from continuing operations
before income taxes
North American Retail $«260 $÷«155 $÷«80
North American Fresh Bakery 33 60 14
North American Foodservice 54 (302) 135
International Beverage 488 547 317
International Bakery (193) (346) 38
International Household and Body Care 242 315 272
Total operating segment income 884 429 856
Amortization of intangibles (65) (67) (64)
General corporate expenses
Other (238) (254) (352)
Mark-to-market derivative gains/(losses) (18) 22 2
Contingent sale proceeds 150 130 120
Total operating income 713 260 562
Interest expense, net (125) (100) (133)
Income from continuing operations
before income taxes $«588 $÷«160 $«429
A discussion of each business segment’s sales and operating
segment income is presented on the following pages.
The change in unit volumes for each business segment excludes
the impact of acquisitions and dispositions, if any.
The amortization of intangibles in the preceding table relates
to trademarks and customer relationships. It does not include soft-
ware amortization, a portion of which is recognized in the earnings
of the segments and a portion is recognized as part of general
corporate expenses.
Total general corporate expenses, which are not allocated to
the individual business segments, were $256 million in 2009, an
increase of $24 million over the prior year. This increase was driven
by the year-over-year change in mark-to-market derivative gains/
(losses). In 2009, there were $18 million of unrealized mark-to-market
losses incurred on commodity derivative contracts, primarily related
to energy, versus unrealized gains on commodity derivatives of
$22 million in 2008. Other general corporate expenses decreased
$16 million versus the prior year due to lower pension costs and
favorable foreign currency transactions partially offset by increased
professional fees for consulting and special project work. General
corporate expenses were also favorably impacted by approximately
$22 million related to certain nonrecurring items – primarily a
non-income related foreign tax refund and a reduction in contingent
lease accruals.
In 2008, total general corporate expenses of $232 million were
$118 million lower than 2007 due to lower transformation related
costs, a reduction in pension and other benefit plan expenses, the
non-recurrence of costs associated with the corporation’s hedging
program and a $20 million increase in unrealized mark-to-market
gains on commodity derivatives.
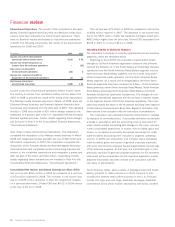
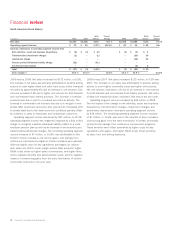
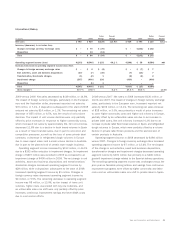
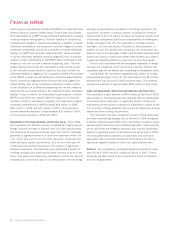
The impact of the costs related to exit activities and asset and
business dispositions, transformation and Project Accelerate costs
and impairment charges on the corporation’s business segments
and general corporate expenses are summarized as follows:
In millions 2009 2008 2007
North American Retail $÷÷– $÷34 $118
North American Fresh Bakery 37 3 42
North American Foodservice 106 436 11
International Beverage 32 15 139
International Bakery 245 409 18
International Household and Body Care 10 7 17
Impact on the business segments 430 904 345
General corporate expenses 31 37 72
Impact on income from continuing
operations before income taxes $461 $941 $417
The most significant charges in the above table relate to impair-
ment charges. In 2009, impairment charges of $107 million and
$207 million were recognized in North American Foodservice and
International Bakery, respectively. In 2008, impairment charges of
$431 million and $400 million were recognized in North American
Foodservice and International Bakery, respectively. In 2007, an
impairment charge of $118 million was recognized in International
Beverage. Additional information regarding the amount and nature
of the above charges is provided in the individual business segment
discussions that follow.