Red Lobster 1999 Annual Report Download - page 2
Download and view the complete annual report
Please find page 2 of the 1999 Red Lobster annual report below. You can navigate through the pages in the report by either clicking on the pages listed below, or by using the keyword search tool below to find specific information within the annual report.-
 1
1 -
 2
2 -
 3
3 -
 4
4 -
 5
5 -
 6
6 -
 7
7 -
 8
8 -
 9
9 -
 10
10 -
 11
11 -
 12
12 -
 13
13 -
14
-
15
-
16
-
17
-
18
-
19
-
20
-
21
-
22
-
23
-
24
-
25
-
26
-
27
-
28
 |
 |

Management’s Discussion
of Results of Operations and Financial Condition
23
During 1997, an after-tax restructuring and asset impair-
ment charge of $145.4 million (93 cents per diluted share)
was taken in the fourth quarter related to low-performing
restaurant properties in the U.S. and Canada and other
long-lived assets including those restaurants that have
been closed. The pre-tax charge includes approximately
$160.7 million of non-cash charges primarily related to the
write-down of buildings and equipment to net realizable
value and approximately $69.2 million of charges to be
settled in cash related to carrying costs of buildings and
equipment prior to their disposal, lease buy-out provi-
sions, employee severance and other costs. Cash required
to carry out these activities is being provided by opera-
tions and the sale of closed properties (see Note 3 of
Notes to Consolidated Financial Statements).
During 1999, an after-tax restructuring credit of $5.2 million
(four cents per diluted share) was taken in the fourth
quarter as the Company reversed a portion of its 1997
restructuring liability. The reversal resulted from the
Company’s decision to close fewer restaurants than
identified for closure as part of the restructuring action.
The credit has no effect on the Company’s cash flow. (See
Note 3 of Notes to Consolidated Financial Statements.)
LIQUIDITY AND CAPITAL RESOURCES
The Company intends to manage its business and its
financial ratios to maintain an investment grade bond
rating, which allows access to financing at reasonable
costs. Currently, the Company’s publicly issued long-term
debt carries
“
Baa1” (Moody’s Investor Services, Inc.),
“BBB” (Standard & Poor’s Corporation) and “BBB+”
(Duff & Phelps Corporation) ratings. The Company’s
commercial paper has ratings of “P-2” (Moody’s), “A-2”
(Standard & Poor’s) and “D-2” (Duff & Phelps).
Darden’s long-term debt includes $150 million of
6.375 percent notes due in 2006 and $100 million of
7.125 percent debentures due in 2016. The effective
annual interest rate is 7.57 percent for the notes and
7.82 percent
for the debentures, after consideration of
loan costs,
issuance discounts and costs to terminate an
interest-rate swap agreement that was established prior
to the distribution from General Mills.
Darden’s long-term debt also includes a $66.9 million
commercial bank loan to the Company, with an outstand-
ing principal balance of $60.2 million as of May 30, 1999,
that is used to support two loans from the Company to
the Employee Stock Ownership Plan portion of the Darden
Savings Plan (the ESOP). During the fiscal year ended
May 25, 1997, the ESOP refinanced $50 million in existing
debt which was previously guaranteed by the Company.
The refinancing was accomplished by the commercial
bank’s loan to the Company and a corresponding loan
from the Company to the ESOP.
Commercial paper is the primary source of short-term
financing. Bank credit lines are maintained to ensure
availability of short-term funds on an as-needed basis.
Available fee-paid credit lines, all of which are unused at
May 30, 1999, total $250 million.
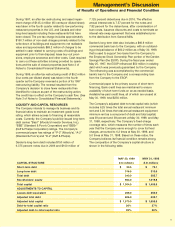
The Company’s adjusted debt-to-total capital ratio (which
includes 6.25 times the total annual restaurant minimum
rent and 3.00 times the total annual restaurant equipment
minimum rent as a component of debt and total capital)
was 39 percent and 38 percent at May 30, 1999, and May
31, 1998, respectively. The Company’s fixed-charge
coverage ratio, which measures the number of times each
year that the Company earns enough to cover its fixed
charges, amounted to 6.2 times at May 30, 1999, and
5.0 times at May 31, 1998. Based on these ratios, the
Company believes its financial condition remains strong.
The composition of the Company’s capital structure is
shown in the following table.
MAY 30, 1999 MAY 31, 1998
CAPITAL STRUCTURE $ In millions $ In millions
Short-term debt $ 23.5 $ 75.1
Long-term debt 316.5 310.6
Total debt 340.0 385.7
Stockholders’ equity 964.0 1,019.8
Total capital $ 1,304.0 $ 1,405.5
ADJUSTMENTS TO CAPITAL
Leases-debt equivalent 266.0 250.0
Adjusted total debt 606.0 635.7
Adjusted total capital $ 1,570.0 $ 1,655.5
Debt-to-total capital ratio 26% 27%
Adjusted debt-to-total capital ratio 39% 38%