Red Lobster 1999 Annual Report Download - page 1
Download and view the complete annual report
Please find page 1 of the 1999 Red Lobster annual report below. You can navigate through the pages in the report by either clicking on the pages listed below, or by using the keyword search tool below to find specific information within the annual report.-
 1
1 -
 2
2 -
 3
3 -
 4
4 -
 5
5 -
 6
6 -
 7
7 -
 8
8 -
 9
9 -
 10
10 -
 11
11 -
 12
12 -
13
-
14
-
15
-
16
-
17
-
18
-
19
-
20
-
21
-
22
-
23
-
24
-
25
-
26
-
27
-
28
 |
 |

22
Darden Restaurants, Inc. (Darden or the Company) was
created as an independent, publicly held company in
May 1995 through the spin-off of all of General Mills’
restaurant operations to its shareholders. Darden
operates 1,139 Red Lobster, Olive Garden and Bahama
Breeze restaurants in the U.S. and Canada and licenses
38 restaurants in Japan. All of the restaurants in the
U.S. and Canada are operated by the Company with
no franchising.
This discussion should be read in conjunction with the
business information and the consolidated financial
statements and related notes found elsewhere in this
report. Darden’s fiscal year ends on the last Sunday
in May.
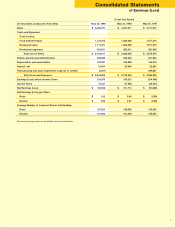
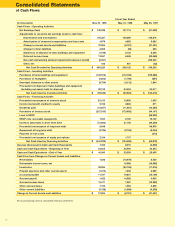
REVENUES
Total revenues in 1999 (52 weeks) were $3.46 billion,
a five percent increase from 1998 (53 weeks). Total
revenues in 1998 were $3.29 billion, a four percent
increase from 1997.
COSTS AND EXPENSES
Food and beverage costs for 1999 were 32.8 percent
of sales, a decrease of 0.2 percentage points from 1998
and a decrease of 1.2 percentage points from 1997. The
higher level of food and beverage costs for 1997, as a
percentage of sales, primarily resulted from the reposi-
tioning strategy at Red Lobster, initiated in 1997’s sec-
ond quarter, that lowered check averages and improved
food by providing larger portions and enhancing food
quality and presentation. Profit margins increased during
1999 and 1998 primarily as a result of increased sales,
higher margin food items and favorable food costs.
Restaurant labor was comparable year to year at
32.3 percent of sales in 1999 against 32.3 percent in
1998 and 32.1 percent in 1997.
Restaurant expenses (primarily lease expenses, property
taxes, utilities and workers’ compensation costs)
decreased in 1999 to 14.3 percent of sales compared
to 14.7 percent in 1998 and 15.2 percent in 1997. The
1999 and 1998 decreases resulted primarily from
increased sales levels.
Selling, general and administrative expenses declined in
1999 to 10.4 percent of sales compared to 10.9 percent
in 1998 and 11.4 percent in 1997. The 1999 and 1998
declines resulted from an overall decrease in marketing
costs each year and increased sales levels.
Depreciation and amortization expense of 3.6 percent of
sales in 1999 decreased from 3.8 percent in 1998 and
4.3 percent in 1997. The 1999 and 1998 decreases
resulted from increased sales levels, restaurant closings
and asset impairment write-downs that occurred during
1997’s fourth quarter. Interest expense of 0.6 percent of
sales in 1999 and 1998 decreased from 0.7 percent in 1997.
INCOME FROM OPERATIONS
Pre-tax earnings before restructuring credit increased
by 35 percent in 1999 to $207.4 million, compared to
$153.7 million in 1998 and $75.4 million before restruc-
turing and asset impairment charges in 1997. The
increase in 1999 was mainly attributable to annual
same-restaurant sales increases in the U.S. for both
Red Lobster and Olive Garden totaling 7.4 percent and
9.0 percent, respectively. Red Lobster and Olive Garden
have enjoyed six and 19 consecutive quarters of
same-restaurant sales increases, respectively. The
increase in 1998 was mainly attributable to substantially
higher earnings at Red Lobster resulting from actions
beginning in the second quarter of 1997 intended to
enhance long-term performance through new menu
items, bolder
flavors, more choices at lower prices and
service
improvements. Olive Garden also posted a solid
increase in earnings in 1998. Fiscal 1998 same-restaurant
sales increases in the U.S. for Red Lobster and Olive
Garden totaled 2.5 percent and 8.3 percent, respectively.
PROVISION FOR INCOME TAXES
The effective tax rate for 1999 before restructuring credit
was 34.8 percent compared to 33.8 percent in 1998 and
27.9 percent before restructuring and asset impairment
charges in 1997. The higher effective tax rate in 1999
resulted from higher pre-tax earnings. The 34.9 percent
rate in 1999, after restructuring credit, compared to
1998’s 33.8 percent rate and to 1997’s 41.1 percent
benefit after restructuring and asset impairment charges.
The unusual effective rate in 1997 resulted from operating
losses combined with federal income tax credits, both of
which created an income tax benefit.
NET EARNINGS AND NET EARNINGS PER
SHARE BEFORE RESTRUCTURING AND ASSET
IMPAIRMENT EXPENSE OR (CREDIT)
Net earnings before restructuring credit for 1999 of
$135.3 million or 96 cents per diluted share increased
33 percent, compared to 1998 net earnings of
$101.7 million or 67 cents per diluted share. 1998 net
earnings increased 87 percent, compared to net earnings
before restructuring and asset impairment charges for
1997 of $54.3 million or 35 cents per diluted share.
NET EARNINGS (LOSS) AND NET EARNINGS
(LOSS) PER SHARE
Net earnings after restructuring credit for 1999 of
$140.5 million (99 cents per diluted share) compared
with 1998’s net earnings of $101.7 million (67 cents per
diluted share) and 1997’s net loss after restructuring and
asset impairment charges of $(91.0) million (59 cents per
diluted share).
Management’s Discussion
of Results of Operations and Financial Condition