Rayovac 2013 Annual Report Download - page 8
Download and view the complete annual report
Please find page 8 of the 2013 Rayovac annual report below. You can navigate through the pages in the report by either clicking on the pages listed below, or by using the keyword search tool below to find specific information within the annual report.-
 1
1 -
 2
2 -
 3
3 -
 4
4 -
 5
5 -
 6
6 -
 7
7 -
 8
8 -
 9
9 -
 10
10 -
 11
11 -
 12
12 -
 13
13 -
 14
14 -
 15
15 -
 16
16 -
 17
17 -
 18
18 -
 19
19 -
20
-
21
-
22
-
23
-
24
-
25
-
26
-
27
-
28
-
29
-
30
-
31
-
32
-
33
-
34
-
35
-
36
-
37
-
38
-
39
-
40
-
41
-
42
-
43
-
44
-
45
-
46
-
47
-
48
-
49
-
50
-
51
-
52
-
53
-
54
-
55
-
56
-
57
-
58
-
59
-
60
-
61
-
62
-
63
-
64
-
65
-
66
-
67
-
68
-
69
-
70
-
71
-
72
-
73
-
74
-
75
-
76
-
77
-
78
-
79
-
80
-
81
-
82
-
83
-
84
-
85
-
86
-
87
-
88
-
89
-
90
-
91
-
92
-
93
-
94
-
95
-
96
-
97
-
98
-
99
-
100
-
101
-
102
-
103
-
104
-
105
-
106
-
107
-
108
-
109
-
110
-
111
-
112
-
113
-
114
-
115
-
116
-
117
-
118
-
119
-
120
-
121
-
122
-
123
-
124
-
125
-
126
-
127
-
128
-
129
-
130
-
131
-
132
-
133
-
134
-
135
-
136
-
137
-
138
-
139
-
140
-
141
-
142
-
143
-
144
-
145
-
146
-
147
-
148
-
149
-
150
-
151
-
152
-
153
-
154
 |
 |

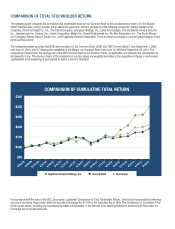
The following graph compares the cumulative total stockholder return on our Common Stock to the cumulative total return of (i) the Russell
2000 Financial Index, and (ii) our peer group selected in good faith, which is composed of the following companies: Central Garden & Pet
Company, Church & Dwight Co., Inc., The Clorox Company, Energizer Holdings, Inc., Exide Technologies, Fortune Brands Home & Security,
Inc., Hanesbrands Inc., Hasbro, Inc., Jarden Corporation, Mattel, Inc., Newell Rubbermaid Inc., Nu Skin Enterprises, Inc., The Scotts Miracle-
Gro Company, Stanley Black & Decker, Inc., and Tupperware Brands Corporation. There has been no change in our peer group between Fiscal
2012 and Fiscal 2013.
The comparison below assumes that $100 was invested in (i) the Common Stock of SBI (the “SBI Common Stock”) from September 2, 2009
until June 16, 2010, and (ii) following the completion of the Merger, our Common Stock from June 16, 2010 until September 30, 2013. The
comparison is based upon the closing price of the SBI Common Stock or our Common Stock, as applicable, and assumes the reinvestment of
all dividends, if any. The returns of each of the companies in our peer group are weighted according to the respective company’s stock market
capitalization at the beginning of each period for which a return is indicated.
COMPARISON OF TOTAL STOCKHOLDER RETURN
In accordance with the rules of the SEC, this section, captioned “Comparison of Total Stockholder Return,” shall not be incorporated by reference
into any of our future filings made under the Securities Exchange Act of 1934 or the Securities Act of 1933. The Comparison of Cumulative Total
Return graph above, including any accompanying tables and footnotes, is not deemed to be soliciting material or deemed to be filed under the
Exchange Act or the Securities Act.