Rayovac 2002 Annual Report Download - page 8
Download and view the complete annual report
Please find page 8 of the 2002 Rayovac annual report below. You can navigate through the pages in the report by either clicking on the pages listed below, or by using the keyword search tool below to find specific information within the annual report.-
 1
1 -
 2
2 -
 3
3 -
 4
4 -
 5
5 -
 6
6 -
 7
7 -
 8
8 -
 9
9 -
 10
10 -
 11
11 -
 12
12 -
 13
13 -
 14
14 -
 15
15 -
 16
16 -
 17
17 -
 18
18 -
 19
19 -
20
-
21
-
22
-
23
-
24
-
25
-
26
-
27
-
28
-
29
-
30
-
31
-
32
-
33
-
34
-
35
-
36
-
37
-
38
-
39
-
40
-
41
-
42
-
43
-
44
-
45
-
46
-
47
-
48
-
49
-
50
-
51
-
52
-
53
-
54
-
55
-
56
-
57
-
58
-
59
-
60
-
61
-
62
-
63
-
64
-
65
-
66
-
67
 |
 |

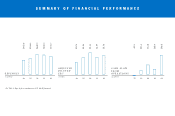
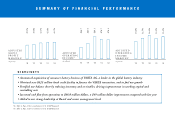
ADJUSTED
OPERATING
INCOME
3
(in millions) ’98 ’99 ’00 ’01 ’02
$46.7
$63.0
$89.3
$76.7
$76.2
’02
ADJUSTED
OPERATING
INCOME
MARGINS
3
(in percent) ’98 ’99 ’00 ’01
10.6%
12.5%
14.2%
12.4%
13.3%
’98 ’99 ’00 ’01 ’02
39.1%
39.6%
41.1%
41.4%
41.7%
A
DJUSTED
GROSS
PROFIT
MARGINS
2
(in percent)
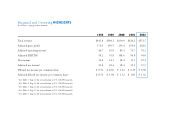
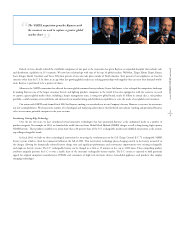
• Announced acquisition of consumer battery business of VARTA AG, a leader in the global battery industry
• Obtained new $625 million bank credit facility to finance the VARTA transaction, and to fuel our growth
• Fortified our balance sheet by reducing inventory and receivables, driving improvements in working capital and
controlling costs
• Increased cash flow from operations to $66.8 million dollars, a $49 million dollar improvement compared with last year
• Added to our strong leadership at Board and senior management levels
HIGHLIGHTS
SUMMARY OF FINANCIAL PERFORMANCE
2 See Table 2, Page 12 for reconciliation to U.S. GAAP financials.
3 See Table 3, Page 12 for reconciliation to U.S. GAAP financials.