Rayovac 2002 Annual Report Download - page 17
Download and view the complete annual report
Please find page 17 of the 2002 Rayovac annual report below. You can navigate through the pages in the report by either clicking on the pages listed below, or by using the keyword search tool below to find specific information within the annual report.-
 1
1 -
2
-
3
-
4
-
5
-
6
-
 7
7 -
 8
8 -
 9
9 -
 10
10 -
 11
11 -
 12
12 -
 13
13 -
 14
14 -
 15
15 -
 16
16 -
 17
17 -
 18
18 -
 19
19 -
 20
20 -
 21
21 -
 22
22 -
 23
23 -
 24
24 -
 25
25 -
 26
26 -
 27
27 -
28
-
29
-
30
-
31
-
32
-
33
-
34
-
35
-
36
-
37
-
38
-
39
-
40
-
41
-
42
-
43
-
44
-
45
-
46
-
47
-
48
-
49
-
50
-
51
-
52
-
53
-
54
-
55
-
56
-
57
-
58
-
59
-
60
-
61
-
62
-
63
-
64
-
65
-
66
-
67
 |
 |

to our SHAREHOLDERS [continued]
Overcoming Challenges
While we would be proud of our fiscal year 2002 achievements in any envi-
ronment, we’re particularly pleased that we delivered them during what was the most
challenging period that our industry has faced in recent years. Heated competition
in the U.S. battery industry characterized by intense promotional pricing resulted in vir-
tually no alkaline category dollar growth for the second consecutive year—a first in the industry’s
history. The sluggish U.S. economy influenced the retail environment and caused retailers to be cautious about
inventory levels. Slowing sales of small electronic devices that are important to battery market growth also impacted the category.
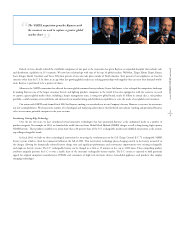
Kmart, the nation’s second largest retailer and a key Rayovac customer, fell victim to the tough economic times and filed for Chapter 11 bank-
ruptcy protection. In Latin America, another important Rayovac market, weak economic conditions, political turmoil and currency devaluations all con-
tributed to a depressed consumer products market and significant year-over-year declines in the battery category.
We responded swiftly and effectively to these challenges, meeting the industry issues head-on. In spite of the difficult economic environment and intense
competition, we maintained our overall market share in our key markets. In the U.S., we added new customers in alternate channels to help offset the negative
impact of the economic environment. And in Latin America, we took aggressive measures to retain our market share while reducing our cost structure.
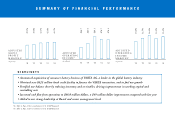
Delivering Solid Performance
While our operating performance in fiscal 2002 enabled us to deliver better earnings than in 2001, the stress of the year’s market pressures still impacted
our financial results. Sales declined seven percent to $572.7 million, compared with $616.2 million in the last fiscal year. Diluted earnings per share increased
to $0.90 from $0.39 last year at this time. Adjusted diluted earnings per share was $1.16, an increase from the $1.05 reported for the same period a year ago.1
Though these financial results are not consistent with Rayovac’s long-term goals, we are still gratified that we were able to deliver such solid performance under
trying short-term market conditions.
We also fortified our balance sheet during fiscal 2002. We achieved substantial improvements in working capital, reducing inventory by $7 million and
accounts receivable by $32 million. At the same time, we continued to exercise the stringent cost management disciplines that are an essential part of Rayovac’s
management culture. As a result, we boosted our cash flow from operations to $66.8 million, a $49 million increase year over year.
1See Table 1‚ Page 12 for reconciliation to U.S. GAAP financials.
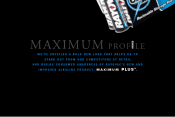
The patent pending I-C3rechargeable NiMH battery can be charged
in 15 minutes or less in our I-C3charger, providing consumers with
unparalleled convenience and compelling cost savings.
6
7