Rayovac 2002 Annual Report Download - page 3
Download and view the complete annual report
Please find page 3 of the 2002 Rayovac annual report below. You can navigate through the pages in the report by either clicking on the pages listed below, or by using the keyword search tool below to find specific information within the annual report.-
 1
1 -
 2
2 -
 3
3 -
 4
4 -
 5
5 -
 6
6 -
 7
7 -
 8
8 -
 9
9 -
 10
10 -
 11
11 -
 12
12 -
 13
13 -
 14
14 -
15
-
16
-
17
-
18
-
19
-
20
-
21
-
22
-
23
-
24
-
25
-
26
-
27
-
28
-
29
-
30
-
31
-
32
-
33
-
34
-
35
-
36
-
37
-
38
-
39
-
40
-
41
-
42
-
43
-
44
-
45
-
46
-
47
-
48
-
49
-
50
-
51
-
52
-
53
-
54
-
55
-
56
-
57
-
58
-
59
-
60
-
61
-
62
-
63
-
64
-
65
-
66
-
67
 |
 |

1998 1999 2000 2001 2002
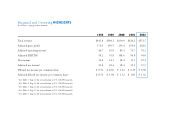
Total revenue $441.8 $504.2 $630.9 $616.2 $572.7
Adjusted gross profit2172.9 199.5 259.4 255.0 238.6
Adjusted operating income346.7 63.0 89.3 76.7 76.2
Adjusted EBITDA459.2 76.8 108.6 96.8 94.0
Net income 14.4 24.1 38.4 11.5 29.2
Adjusted net income521.4 30.4 38.4 31.1 37.5
Diluted net income per common share $ 0.51 $ 0.83 $ 1.32 $ 0.39 $ 0.90
Adjusted diluted net income per common share1$ 0.74 $ 1.04 $ 1.32 $ 1.05 $ 1.16
1See Table 1‚ Page 12 for reconciliation to U.S. GAAP financials.
2See Table 2‚ Page 12 for reconciliation to U.S. GAAP financials.
3See Table 3‚ Page 12 for reconciliation to U.S. GAAP financials.
4See Table 4, Page 12 for reconciliation to U.S. GAAP financials.
5See Table 5, Page 12 for reconciliation to U.S. GAAP financials.
Financial and Operating HIGHLIGHTS
In millions, except per-share amounts