Rayovac 2001 Annual Report Download - page 7
Download and view the complete annual report
Please find page 7 of the 2001 Rayovac annual report below. You can navigate through the pages in the report by either clicking on the pages listed below, or by using the keyword search tool below to find specific information within the annual report.-
 1
1 -
 2
2 -
 3
3 -
 4
4 -
 5
5 -
 6
6 -
 7
7 -
 8
8 -
 9
9 -
 10
10 -
 11
11 -
 12
12 -
 13
13 -
 14
14 -
 15
15 -
 16
16 -
 17
17 -
 18
18 -
19
-
20
-
21
 |
 |

N.A.
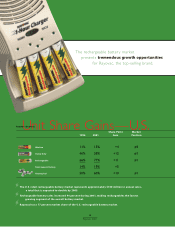
$427.2
14%
$487.4
14%
$555.1
-3%
$675.5
25%
$693.3
N.A.
$0.45
64%
$0.74
41%
$1.04
27%
$1.32
-20%
$1.05
N.A.
$37.5
25%
$46.7
35%
$63.0
-14%
$76.7
42%
$89.3
’
97
’
98
’
99
’
00
’
01
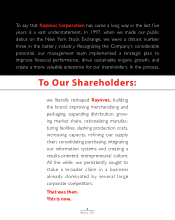
Rayovac’s management team
is keenly focused on driving sales and
profitability, maximizing investment return
and boosting shareholder value.
Revenue Growth
Year Over Year Change
[In Millions]
’
97
’
98
’
99
’
00
’
01
Adjusted Operating Income
Year Over Year Change
[In Millions]
’
97
’
98
’
99
’
00
’
01
Adjusted Diluted EPS
Year Over Year Change
[In Dollars]
CAGR
4 Year Compound Annual Growth Rate
CAGR = +12%CAGR = +20%CAGR = +24%
4
Rayovac 2001