Qantas 2003 Annual Report Download - page 34
Download and view the complete annual report
Please find page 34 of the 2003 Qantas annual report below. You can navigate through the pages in the report by either clicking on the pages listed below, or by using the keyword search tool below to find specific information within the annual report.-
 1
1 -
2
-
3
-
4
-
5
-
6
-
7
-
8
-
9
-
10
-
11
-
12
-
13
-
14
-
15
-
16
-
17
-
18
-
19
-
20
-
21
-
22
-
23
-
 24
24 -
 25
25 -
 26
26 -
 27
27 -
 28
28 -
 29
29 -
 30
30 -
 31
31 -
 32
32 -
 33
33 -
 34
34 -
 35
35 -
 36
36 -
 37
37 -
 38
38 -
 39
39 -
 40
40 -
 41
41 -
 42
42 -
 43
43 -
 44
44 -
45
-
46
-
47
-
48
-
49
-
50
-
51
-
52
-
53
-
54
-
55
-
56
-
57
-
58
-
59
-
60
 |
 |

page 32
2003 Qantas Annual Report
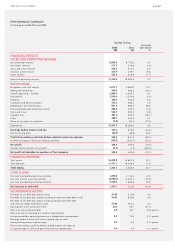
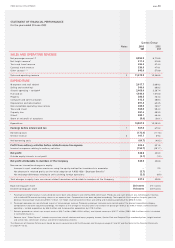
PERFORMANCE SUMMARY
for the year ended 30 June 2003
Qantas Group
Increase/
2003 2002 (Decrease)
$M $M %
FINANCIAL RESULTS
SALES AND OPERATING REVENUE
Net passenger revenue 8,992.8 8,718.5 3.1
Net freight revenue 511.3 518.8 (1.4)
Tours and travel revenue 696.3 674.4 3.2
Contract work revenue 530.9 479.1 10.8
Other sources 643.6 578.0 11.3
Sales and operating revenue 11,374.9 10,968.8 3.7
EXPENDITURE
Manpower and staff related 3,017.7 2,689.2 12.2
Selling and marketing 546.6 608.2 (10.1)
Aircraft operating – variable 2,405.0 2,287.4 5.1
Fuel and oil 1,540.4 1,570.0 (1.9)
Property 286.5 264.3 8.4
Computer and communication 412.3 408.4 1.0
Depreciation and amortisation 891.4 693.5 28.5
Non-cancellable operating lease rentals 283.9 255.7 11.0
Tours and travel 564.0 584.4 (3.5)
Capacity hire 381.6 499.9 (23.7)
Other 488.1 464.6 5.1
Share of net profit of associates (9.6) (36.1) (73.4)
Expenditure 10,807.9 10,289.5 5.0
Earnings before interest and tax 567.0 679.3 (16.5)
Net borrowing costs (64.7) (48.3) 34.0
Profit from ordinary activities before related income tax expense 502.3 631.0 (20.4)
Income tax expense relating to ordinary activities (155.7) (201.7) (22.8)
Net profit 346.6 429.3 (19.3)
Outside equity interests in net profit (3.1) (1.3) (138.5)
Net profit attributable to members of the Company 343.5 428.0 (19.7)
FINANCIAL POSITION
To tal assets 16,973.8 14,801.5 14.7
To tal liabilities 11,711.7 10,548.0 11.0
Total equity 5,262.1 4,253.5 23.7
CASH FLOWS
Net cash provided by operating activities 1,290.8 1,143.3 12.9
Net cash used in investing activities (2,995.7) (2,306.1) (29.9)
Net cash provided by financing activities 2,935.6 1,688.8 73.8
Net increase in cash held 1,230.7 526.0 134.0
PERFORMANCE RATIOS
Net debt to net debt plus equity (ratio) 37:63 31:69 n/a
Net debt to net debt plus equity including off balance sheet debt (ratio) 50:50 50:50 n/a
Net debt to net debt plus equity including off balance sheet debt
and revenue hedge receivables (ratio) 51:49 49:51 n/a
Earnings per share (cents per share) 20.0 29.1 (31.3)
Return on equity (percentage) 6.5 10.1 (3.6) points
Return on equity including the notional capitalisation
of non-cancellable operating leases on a hedged basis (percentage) 8.9 12.0 (3.1) points
Earnings before interest and tax as a percentage of sales
and operating revenue (percentage) 5.0 6.2 (1.2) points
Profit from ordinary activities before related income tax expense
as a percentage of sales and operating revenue (percentage) 4.4 5.8 (1.4) points