Qantas 2001 Annual Report Download - page 51
Download and view the complete annual report
Please find page 51 of the 2001 Qantas annual report below. You can navigate through the pages in the report by either clicking on the pages listed below, or by using the keyword search tool below to find specific information within the annual report.-
 1
1 -
2
-
3
-
4
-
5
-
6
-
7
-
8
-
9
-
10
-
11
-
12
-
13
-
14
-
15
-
16
-
17
-
18
-
19
-
20
-
21
-
22
-
23
-
24
-
25
-
26
-
27
-
28
-
29
-
30
-
31
-
32
-
33
-
34
-
35
-
36
-
37
-
38
-
39
-
40
-
 41
41 -
 42
42 -
 43
43 -
 44
44 -
 45
45 -
 46
46 -
 47
47 -
 48
48 -
 49
49 -
 50
50 -
 51
51 -
 52
52
 |
 |

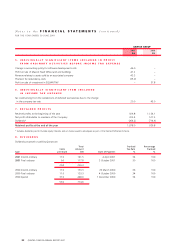
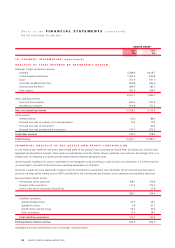
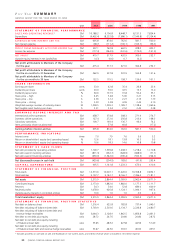
Five Year SUMMARY (continued)
QANTAS GROUP FOR THE YEAR ENDED 30 JUNE
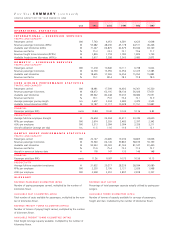
GLOSSARY
REVENUE PASSENGER KILOMETRES (RPKs)
Number of paying passengers carried, multiplied by the number of
kilometres flown.
AVAILABLE SEAT KILOMETRES (ASKs)
Total number of seats available for passengers, multiplied by the num-
ber of kilometres flown.
REVENUE FREIGHT TONNE KILOMETRES (RFTKs)
Number of tonnes of paying freight carried, multiplied by the number
of kilometres flown.
AVAILABLE FREIGHT TONNE KILOMETRES (AFTKs)
Total freight tonnage capacity available, multiplied by the number of
kilometres flown.
REVENUE SEAT FACTOR
Percentage of total passenger capacity actually utilised by paying pas-
sengers.
AVAILABLE TONNE KILOMETRES (ATKs)
Number of tonnes of capacity available for carriage of passengers,
freight and mail, multiplied by the number of kilometres flown.
Unit 2001 2000 1999 1998 1997
OPERATIONAL STATISTICS
INTERNATIONAL – SCHEDULED SERVICES
TRAFFIC AND CAPACITY
Passengers carried 000 7,763 6,953 6,581 6,623 6,698
Revenue passenger kilometres (RPKs) M 53,682 48,236 45,178 44,511 45,266
Available seat kilometres (ASKs) M 71,247 64,879 62,679 63,034 63,169
Revenue seat factor % 75.3 74.3 72.1 70.6 71.7
Revenue freight tonne kilometres (RFTKs) M 1,859 1,718 1,783 1,829 1,759
Available freight tonne kilometres (AFTKs) M 2,617 2,398 2,565 3,085 2,872
DOMESTIC – SCHEDULED SERVICES
TRAFFIC AND CAPACITY
Passengers carried 000 11,218 10,646 10,111 9,738 9,622
Revenue passenger kilometres M 14,790 13,959 12,956 12,415 12,385
Available seat kilometres M 18,695 17,369 16,554 15,952 15,882
Revenue seat factor % 79.1 80.4 78.3 77.8 78.0
CORE AIRLINE PERFORMANCE STATISTICS
TRAFFIC AND CAPACITY
Passengers carried 000 18,981 17,599 16,692 16,361 16,320
Revenue passenger kilometres M 68,472 62,195 58,134 56,926 57,651
Available seat kilometres M 89,942 82,248 79,233 78,986 79,051
Revenue seat factor % 76.1 75.6 73.4 72.1 72.9
Average passenger journey length km 3,607 3,534 3,483 3,479 3,533
Available tonne kilometres (ATKs) M 12,187 11,117 10,928 11,151 10,887
FINANCIAL
Passenger yield (per RPK) cents 10.84 10.42 10.34 10.16 9.82
PRODUCTIVITY
Average full-time employee strength # 25,604 24,304 23,411 23,749 24,620
RPKs per employee 000 2,674 2,559 2,483 2,397 2,342
ASKs per employee 000 3,513 3,384 3,384 3,326 3,211
Aircraft utilisation (average per day) hrs 11.5 11.6 11.6 11.7 12.1
QANTAS GROUP PERFORMANCE STATISTICS
TRAFFIC AND CAPACITY
Passengers carried 000 22,147 20,485 19,236 18,865 18,606
Revenue passenger kilometres M 70,540 64,149 59,863 58,619 59,199
Available seat kilometres M 92,943 85,033 81,765 81,537 81,440
Revenue seat factor % 75.9 75.4 73.2 71.9 72.7
Aircraft in service at balance date # 178 147 135 146 148
FINANCIAL
Passenger yield (per RPK) cents 11.26 10.87 10.75 10.56 10.15
PRODUCTIVITY
Average full-time equivalent employees # 31,632 29,217 28,226 28,934 30,080
RPKs per employee 000 2,230 2,196 2,121 2,026 1,968
ASKs per employee 000 2,938 2,910 2,897 2,818 2,707