Qantas 2001 Annual Report Download - page 37
Download and view the complete annual report
Please find page 37 of the 2001 Qantas annual report below. You can navigate through the pages in the report by either clicking on the pages listed below, or by using the keyword search tool below to find specific information within the annual report.-
 1
1 -
2
-
3
-
4
-
5
-
6
-
7
-
8
-
9
-
10
-
11
-
12
-
13
-
14
-
15
-
16
-
17
-
18
-
19
-
20
-
21
-
22
-
23
-
24
-
25
-
26
-
 27
27 -
 28
28 -
 29
29 -
 30
30 -
 31
31 -
 32
32 -
 33
33 -
 34
34 -
 35
35 -
 36
36 -
 37
37 -
 38
38 -
 39
39 -
 40
40 -
 41
41 -
 42
42 -
 43
43 -
 44
44 -
 45
45 -
 46
46 -
 47
47 -
48
-
49
-
50
-
51
-
52
 |
 |

THE SPIRIT OF AUSTRALIA p35
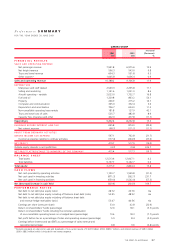
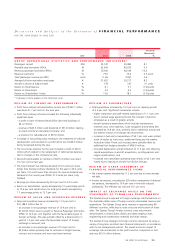
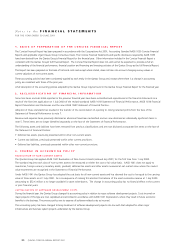
REVIEW OF FINANCIAL PERFORMANCE
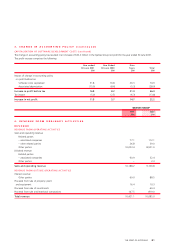
•Profit from ordinary activities before income tax of $597.1 million
was down 21.7 per cent on the prior year.
•Profit from ordinary activities included the following individually
significant items:
– a profit on sale of Mascot Head Office land and buildings of
$41.2 million;
– revenue of $43.3 million and dividends of $31.8 million relating
to assets sold by an associated company; and
– a provision for redundancies of $35.0 million.
•A change in accounting policy relating to the treatment of software
development costs resulted in a profit before tax of $46.0 million
being recognised during the year.
•The income tax expense for the year included a credit of $20.0
million which related to the restatement of deferred tax balances
due to changes in the company tax rate.
•Net profit attributable to members of $415.4 million was down
19.7 per cent on last year.
•The fully franked final ordinary dividend of 9.0 cents per share
brings fully franked ordinary dividends for the year to 20.0 cents
per share, 2.0 cents lower than last year. No special dividend was
declared in the current year (2000: 37.0 cents per share, fully
franked).
•Earnings per share decreased by 22.9 per cent to 33.0 cents.
•Return on shareholders’ equity decreased by 5.5 percentage points
to 12.6 per cent whilst return on total gross assets decreased by
1.7 percentage points to 13.7 per cent.
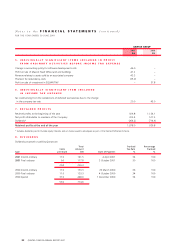
REVIEW OF SALES AND OPERATING REVENUE
•Sales and operating revenue increased by 11.9 per cent to
$10,188.2 million due to:
– an increase in net passenger revenue of 13.9 per cent to
$7,941.8 million due to growth in Revenue Passenger Kilometres
(RPKs) of 10.0 per cent together with the favourable impact of
foreign exchange. This was partially offset by a deterioration in
yield of 1.9 per cent when the favourable impact of foreign
exchange is removed; and
– an increase in non-passenger revenue of 5.4 per cent to
$2,246.4 million primarily due to increases in freight revenue,
contract work revenue and tours and travel revenue.
REVIEW OF EXPENDITURE
•Total expenditure increased by 15.3 per cent on capacity growth
of 9.3 per cent. Significant movements include:
– higher manpower and staff-related expenditure of 11.1 per cent
due to revised wage agreements and the increase in full-time
employees as a result of greater activity;
– aircraft operating expenditure which includes maintenance
material costs, crew expenses, route navigation and
landing fees
increased by 16.8 per cent, primarily due to additional
activity and
the adverse impact of exchange rate movements;
– increases in fuel and oil expenditure of 54.1 per cent were a direct
result of higher jet fuel prices, additional flying and the weaker
Australian dollar. These cost increases were partially offset by
additional fuel hedging benefits of $406.0 million;
–
increased depreciation and amortisation of 11.5 per cent reflecting
capital expenditure on aircraft acquisitions, reconfigurations and
engine modifications; and
–increased non-cancellable operating lease rentals of 42.1 per cent
mainly due to leasing of aircraft from British Airways
.
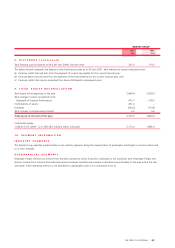
REVIEW OF OTHER STATEMENT OF
FINANCIAL PERFORMANCE ITEMS
•
Net interest expense decreased by 11.2 per cent due to lower average
net debt.
•
Income tax expense, excluding the $20 million restatement of deferred
tax balances, decreased by 19.4 per cent in line with reduced
profitability. The effective tax rate was 33.1 per cent.
IMPACT OF EXCHANGE RATES ON THE
STATEMENT OF FINANCIAL PERFORMANCE
The Qantas Group is exposed to foreign exchange rate fluctuations on
the Australian dollar value of foreign currency dominated revenue and
expenditure. The Qantas Group earns revenue in approximately 80
different countries, reflecting its route structure and location of ticket
sales. The Qantas Group’s foreign currency costs are primarily
denominated in United States dollars and relate largely to fuel,
engineering and maintenance materials and lease rentals.
The Qantas Group manages its foreign currency exposures by using a
variety of long-term and short-term financial instruments, in accordance
with its risk management policies. The overall economic impact of
exchange rate movements on the profit result in comparison to last
year was $61.0 million adverse.
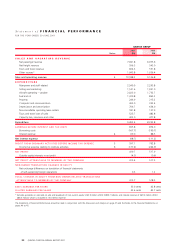
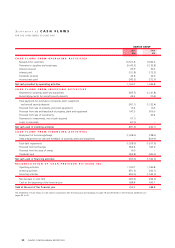
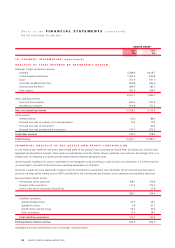
Discussion and Analysis of the Statement of FINANCIAL PERFORMANCE
FOR THE YEAR ENDED 30 JUNE 2001
Increase/
(Decrease)
Unit 2001 2000 %
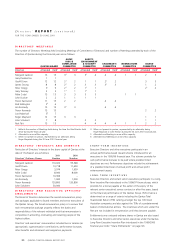
GROUP OPERATIONAL STATISTICS AND PERFORMANCE INDICATORS*
Passengers carried 000 22,147 20,485 8.1
Available seat kilometres (ASKs) M 92,943 85,033 9.3
Revenue passenger kilometres (RPKs) M 70,540 64,149 10.0
Revenue seat factor % 75.9 75.4 0.5 point
Yield (passenger revenue per RPK) cents 11.26 10.87 3.6
Average full-time equivalent employees # 31,632 29,217 8.3
Aircraft in service at balance date # 178 147 31 units
Return on Total Revenue % 4.1 5.7 (1.6) points
Return on Total Assets % 3.3 4.3 (1.0) points
Return on Shareholders’ Funds % 12.6 18.1 (5.5) points
* A glossary of terms appears on the inside back cover.