Qantas 2001 Annual Report Download - page 43
Download and view the complete annual report
Please find page 43 of the 2001 Qantas annual report below. You can navigate through the pages in the report by either clicking on the pages listed below, or by using the keyword search tool below to find specific information within the annual report.-
 1
1 -
2
-
3
-
4
-
5
-
6
-
7
-
8
-
9
-
10
-
11
-
12
-
13
-
14
-
15
-
16
-
17
-
18
-
19
-
20
-
21
-
22
-
23
-
24
-
25
-
26
-
27
-
28
-
29
-
30
-
31
-
32
-
 33
33 -
 34
34 -
 35
35 -
 36
36 -
 37
37 -
 38
38 -
 39
39 -
 40
40 -
 41
41 -
 42
42 -
 43
43 -
 44
44 -
 45
45 -
 46
46 -
 47
47 -
 48
48 -
 49
49 -
 50
50 -
 51
51 -
 52
52
 |
 |

THE SPIRIT OF AUSTRALIA p41
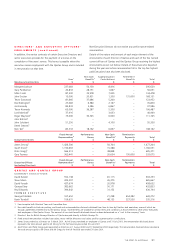
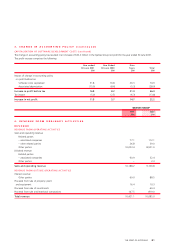
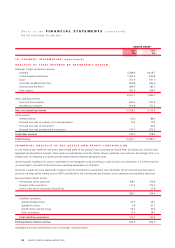
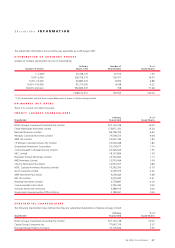
3. CHANGE IN ACCOUNTING POLICY (continued)
CAPITALISATION OF SOFTWARE DEVELOPMENT COSTS (continued)
The change in accounting policy has resulted in an increase of $32.2 million in the Qantas Group net profit for the year ended 30 June 2001.
This profit increase comprises the following:
Year ended Year Ended Prior
30 June 2001 30 June 2000 Years Total
$M $M $M $M
Impact of change in accounting policy
on profit before tax:
Software costs capitalised 31.8 16.8 26.3 74.9
Associated depreciation (15.0) (8.6) (5.3) (28.9)
Increase in profit before tax 16.8 8.2 21.0 46.0
Tax impact (5.0) (2.5) (6.3) (13.8)
Increase in net profit 11.8 5.7 14.7 32.2
QANTAS GROUP
2001 2000
$M $M
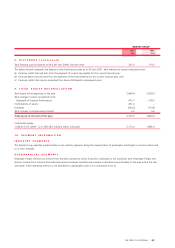
4. REVENUE FROM ORDINARY ACTIVITIES
REVENUE
REVENUE FROM OPERATING ACTIVITIES
Sales and operating revenue
Related parties
– associated companies 77.1 112.1
– other related parties 26.8 39.0
Other parties 10,023.4 8,921.0
Dividend revenue
Related parties
– associated companies 60.9 32.4
Other parties –2.3
Sales and operating revenue 10,188.2 9,106.8
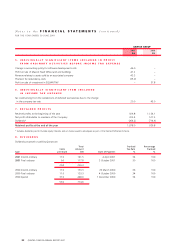
REVENUE FROM OUTSIDE OPERATING ACTIVITIES
Interest revenue
Other parties 69.0 88.5
Proceeds from sale of property, plant
and equipment 16.4 10.3
Proceeds from sale of investments –60.4
Proceeds from sale and leaseback transactions 147.5 819.0
Total revenue 10,421.1 10,085.0