Qantas 2000 Annual Report Download - page 8
Download and view the complete annual report
Please find page 8 of the 2000 Qantas annual report below. You can navigate through the pages in the report by either clicking on the pages listed below, or by using the keyword search tool below to find specific information within the annual report.-
 1
1 -
 2
2 -
 3
3 -
 4
4 -
 5
5 -
 6
6 -
 7
7 -
 8
8 -
 9
9 -
 10
10 -
 11
11 -
 12
12 -
 13
13 -
 14
14 -
 15
15 -
 16
16 -
 17
17 -
 18
18 -
 19
19 -
20
-
21
-
22
-
23
-
24
-
25
-
26
-
27
-
28
-
29
-
30
-
31
-
32
-
33
-
34
-
35
-
36
-
37
-
38
-
39
-
40
-
41
-
42
-
43
-
44
-
45
-
46
-
47
-
48
-
49
-
50
-
51
-
52
 |
 |
6
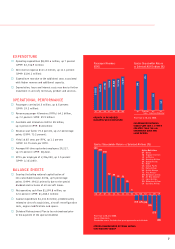
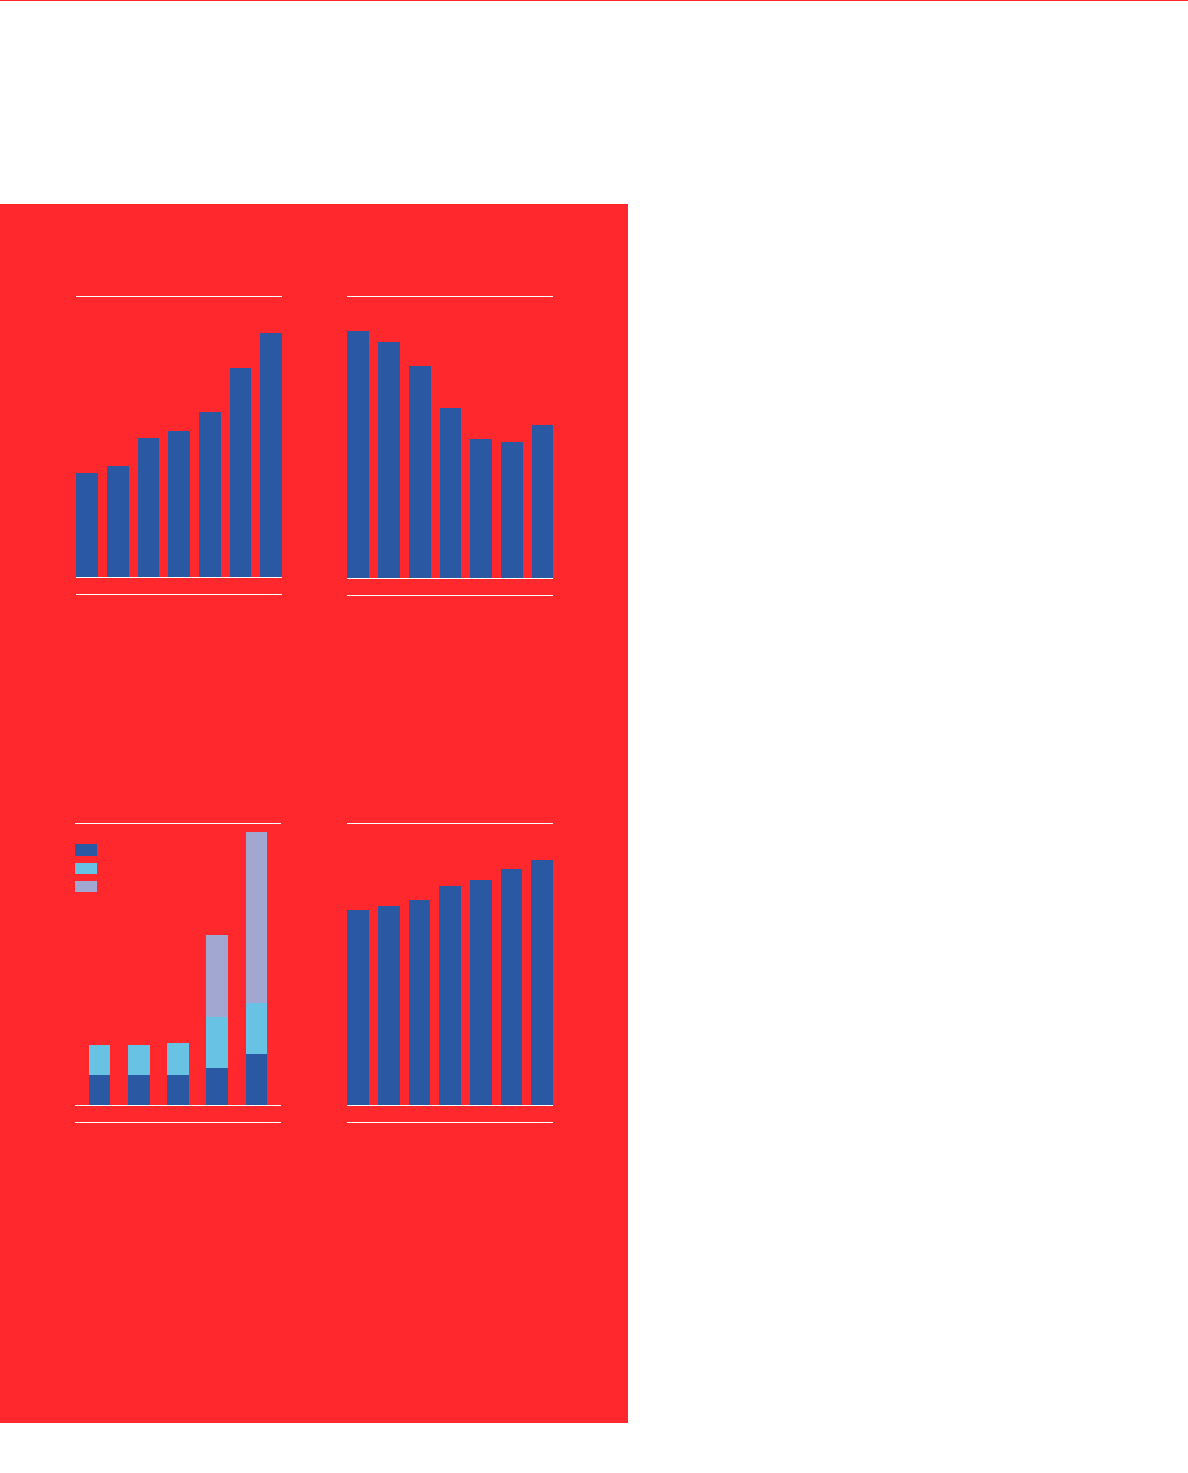
Operating Profit before Tax
and Abnormals ($ million)
94 95 96 97 98 99 00
301.8
320.4
401.4
420.9
478.0
601.7
705.0
Gearing – Adjusted for
Operating Leases (%)
94 95 96 97 98 99 00
71
68
61
49
40
39
44
Dividends
(cents per share)
96
6.56.5
97
6.56.5
98
76.5
99
11 13.58
00
371111
Interim
Final
Special
RPKs per Employee
(000)
94 95 96 97 98 99 00
1,749
1,793
1,844
1,968
2,026
2,121
2,196
THE SPIRIT OF AUSTRALIA
Chief Financial Officer’s Review
OPERATING PROFIT
"
Net profit after tax $517.9 million, up 23 percent
(1999: $420.9 million).
"
Operating profit before tax and abnormals $705 million,
up 17.2 percent (1999: $601.7 million).
"
Abnormal items after tax $82 million, up 110.8 percent
(1999: $38.9 million).
"
Sales and operating revenue $9,106.8 million,
up 7.8 percent (1999: $8,448.7 million).
CONTRIBUTIONS TO EARNINGS
"
International airline operations EBIT up 21.6 percent
to $374.8 million.
"
Domestic airline operations EBIT up 5.9 percent
to $272 million.
"
Subsidiary operations EBIT up 23.9 percent
to $169.4 million.
EARNINGS PERFORMANCE
"
Earnings per share of 42.8 cents, up 20.9 percent
(1999: 35.4 cents).
"
Final dividend of 11 cents per share, fully franked.
"
Special dividend of 37 cents per share, fully franked.
"
Total dividends per share of 59 cents, up 81.5 percent
(1999: 32.5 cents).
"
Qantas Shareholder Return since float of 140 percent,
56 percentage points higher than the All Industrials
and 89 percentage points higher than the All Ordinaries
over the same period.
REVENUE
"
Net passenger revenue $6,975.6 million, up 8.4 percent
(1999: $6,437.5 million).
"
Non-passenger revenue $2,131.2 million, up 6 percent
(1999: $2,011.2 million).
"
Increase in non-passenger revenue driven by
loyalty program revenue, contract work revenue and
tours and travel revenue.
A CONTINUOUS RECORD OF
PROFIT IMPROVEMENT
GEARING REMAINS AT AN
ACCEPTABLE LEVEL
SHAREHOLDER RETURNS
HAVE BEEN MAXIMISED
BY THE PAYMENT OF A
SPECIAL DIVIDEND
PRODUCTIVITY GAINS
CONTINUE TO BE ACHIEVED
ANOTHER RECORD PROFIT