Qantas 2000 Annual Report Download - page 37
Download and view the complete annual report
Please find page 37 of the 2000 Qantas annual report below. You can navigate through the pages in the report by either clicking on the pages listed below, or by using the keyword search tool below to find specific information within the annual report.-
 1
1 -
2
-
3
-
4
-
5
-
6
-
7
-
8
-
9
-
10
-
11
-
12
-
13
-
14
-
15
-
16
-
17
-
18
-
19
-
20
-
21
-
22
-
23
-
24
-
25
-
26
-
 27
27 -
 28
28 -
 29
29 -
 30
30 -
 31
31 -
 32
32 -
 33
33 -
 34
34 -
 35
35 -
 36
36 -
 37
37 -
 38
38 -
 39
39 -
 40
40 -
 41
41 -
 42
42 -
 43
43 -
 44
44 -
 45
45 -
 46
46 -
 47
47 -
48
-
49
-
50
-
51
-
52
 |
 |

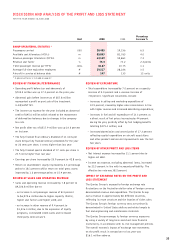
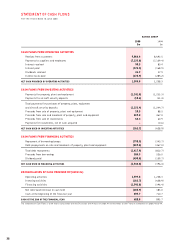
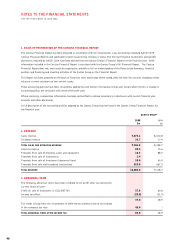
DISCUSSION AND ANALYSIS OF THE PROFIT AND LOSS STATEMENT
FOR THE YEAR ENDED 30 JUNE 2000
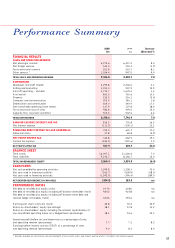
REVIEW OF FINANCIAL PERFORMANCE
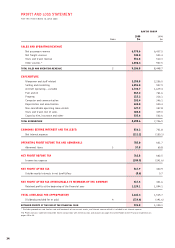
• Operating profit before tax and abnormals of
$705.0 million was up 17.2 percent on the prior year.
• Abnormal gain before income tax of $57.8 million
represented a profit on part sale of the investment
in EQUANT NV.
• The income tax expense for the year included an abnormal
credit of $45.0 million which related to the restatement
of deferred tax balances due to changes in the company
tax rate.
• Net profit after tax of $517.9 million was up 23.0 percent
on last year.
• The fully franked final ordinary dividend of 11 cents per
share brings fully franked ordinary dividends for the year
to 22 cents per share, 3 cents higher than last year.
• The fully franked special dividend of 37 cents per share is
23.5 cents higher than last year.
• Earnings per share increased by 20.9 percent to 42.8 cents.
• Return on shareholders’ equity improved by 4.3 percentage
points to 18.1 percent whilst return on total gross assets
improved by 1.2 percentage points to 15.4 percent.
REVIEW OF SALES AND OPERATING REVENUE
• Sales and operating revenue increased by 7.8 percent to
$9,106.8 million due to:
– an increase in net passenger revenue of 8.4 percent
to $6,975.6 million due to higher capacity (ASKs),
higher seat factors and higher yield; and
– an increase in other revenue of 9.4 percent to
$1,036.4 million, due to the expansion of loyalty
programs, co-branded credit cards and increased
third party contract work.
REVIEW OF EXPENDITURE
• Total expenditure increased by 7.0 percent on a capacity
increase of 4.0 percent and a revenue increase of
7.8 percent. Significant movements include:
– increases in selling and marketing expenditure of
10.9 percent, caused by higher sales commissions in line
with higher revenue and increased advertising expenditure;
– increases in fuel and oil expenditure of 13.3 percent as
a direct result of fuel prices increasing by 44 percent
during the year, partially offset by fuel hedging benefits
totalling $275.4 million; and
– increased depreciation and amortisation of 17.3 percent
reflecting capital expenditure on aircraft acquisitions
and other product and service improvements over the last
two years.
REVIEW OF OTHER PROFIT AND LOSS ITEMS
• Net interest expense increased by 11.1 percent due to
higher net debt.
• Income tax expense, excluding abnormal items, increased
by 22.5 percent in line with increased profitability. The
effective tax rate was 38.2 percent.
IMPACT OF EXCHANGE RATES ON THE PROFIT AND
LOSS STATEMENT
The Qantas Group is exposed to foreign exchange rate
fluctuations on the Australian dollar value of foreign currency
denominated revenue and expenditure. The Qantas Group
earns revenue in approximately 80 different countries,
reflecting its route structure and the location of ticket sales.
The Qantas Group’s foreign currency costs are primarily
denominated in United States dollars and relate largely to
fuel and engineering and maintenance materials.
The Qantas Group manages its foreign currency exposures
by using a variety of long-term and short-term financial
instruments, in accordance with its risk management policies.
The overall economic impact of exchange rate movements
on the profit result in comparison to last year was
$16.1 million adverse.
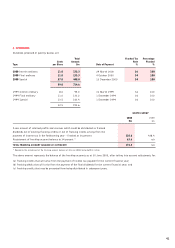
Percentage
Unit 2000 1999 Increase %
GROUP OPERATIONAL STATISTICS *
Passengers carried 000 20,485 19,236 6.5
Available seat kilometres (ASKs) m 85,033 81,765 4.0
Revenue passenger kilometres (RPKs) m 64,149 59,863 7.2
Revenue seat factor % 75.4 73.2 2.2 points
Yield (passenger revenue per RPK) cents 10.87 10.75 1.1
Average full-time equivalent employees # 29,217 28,226 3.5
Aircraft in service at balance date # 147 135 12 units
* A glossary of terms is included on page 47.
35