Qantas 2000 Annual Report Download - page 40
Download and view the complete annual report
Please find page 40 of the 2000 Qantas annual report below. You can navigate through the pages in the report by either clicking on the pages listed below, or by using the keyword search tool below to find specific information within the annual report.-
 1
1 -
2
-
3
-
4
-
5
-
6
-
7
-
8
-
9
-
10
-
11
-
12
-
13
-
14
-
15
-
16
-
17
-
18
-
19
-
20
-
21
-
22
-
23
-
24
-
25
-
26
-
27
-
28
-
29
-
 30
30 -
 31
31 -
 32
32 -
 33
33 -
 34
34 -
 35
35 -
 36
36 -
 37
37 -
 38
38 -
 39
39 -
 40
40 -
 41
41 -
 42
42 -
 43
43 -
 44
44 -
 45
45 -
 46
46 -
 47
47 -
 48
48 -
 49
49 -
 50
50 -
51
-
52
 |
 |

38
QANTAS GROUP
2000 1999
$m $m
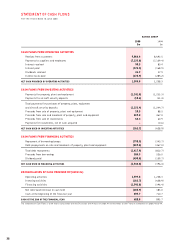
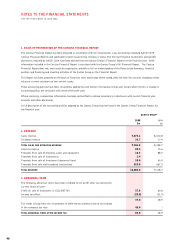
STATEMENT OF CASH FLOWS
FOR THE YEAR ENDED 30 JUNE 2000
CASH FLOWS FROM OPERATING ACTIVITIES
Receipts from customers 9,066.6 8,693.5
Payments to suppliers and employees (7,135.8) (7,129.4)
Interest received 90.5 80.4
Interest paid (175.5) (168.9)
Dividends received 26.9 17.9
Income taxes paid (272.9) (285.2)
NET CASH PROVIDED BY OPERATING ACTIVITIES 1,599.8 1,208.3
CASH FLOWS FROM INVESTING ACTIVITIES
Payments for property, plant and equipment (1,141.8) (1,233.3)
Payments for aircraft security deposits (10.6) (11.4)
Total payments for purchases of property, plant, equipment
and aircraft security deposits (1,152.4) (1,244.7)
Proceeds from sale of property, plant and equipment 10.3 88.5
Proceeds from sale and leaseback of property, plant and equipment 819.0 467.0
Proceeds from sale of investments 60.4 60.9
Payments for investments, net of cash acquired –(0.6)
NET CASH USED IN INVESTING ACTIVITIES (262.7) (628.9)
CASH FLOWS FROM FINANCING ACTIVITIES
Repayment of borrowings/swaps (798.9) (345.7)
Debt prepayments on sale and leaseback of property, plant and equipment (819.0) (467.0)
Total debt repayments (1,617.9) (812.7)
Proceeds from borrowings 505.9 526.0
Dividends paid (430.0) (109.7)
NET CASH USED IN FINANCING ACTIVITIES (1,542.0) (396.4)
RECONCILIATION OF CASH PROVIDED BY/(USED IN):
Operating activities 1,599.8 1,208.3
Investing activities (262.7) (628.9)
Financing activities (1,542.0) (396.4)
Net (decrease)/increase in cash held (204.9) 183.0
Cash at the beginning of the financial year 893.7 710.7
CASH AT THE END OF THE FINANCIAL YEAR 688.8 893.7
The Statement of Cash Flows is to be read in conjunction with the Discussion and Analysis on page 39 and the Notes to the Financial Statements on pages 40 to 44.