Public Storage 2009 Annual Report Download - page 8
Download and view the complete annual report
Please find page 8 of the 2009 Public Storage annual report below. You can navigate through the pages in the report by either clicking on the pages listed below, or by using the keyword search tool below to find specific information within the annual report.-
 1
1 -
 2
2 -
 3
3 -
 4
4 -
 5
5 -
 6
6 -
 7
7 -
 8
8 -
 9
9 -
 10
10 -
 11
11 -
 12
12 -
 13
13 -
 14
14 -
 15
15 -
 16
16 -
 17
17 -
 18
18 -
 19
19 -
20
-
21
-
22
-
23
-
24
-
25
-
26
-
27
-
28
-
29
-
30
-
31
-
32
-
33
-
34
-
35
-
36
-
37
-
38
-
39
-
40
-
41
-
42
-
43
-
44
-
45
-
46
-
47
-
48
-
49
-
50
-
51
-
52
-
53
-
54
-
55
-
56
-
57
-
58
-
59
-
60
-
61
-
62
-
63
-
64
-
65
-
66
-
67
-
68
-
69
-
70
-
71
-
72
-
73
-
74
-
75
-
76
-
77
-
78
-
79
-
80
-
81
-
82
-
83
-
84
-
85
-
86
-
87
-
88
-
89
-
90
-
91
-
92
-
93
-
94
-
95
-
96
-
97
-
98
-
99
-
100
-
101
-
102
-
103
-
104
-
105
-
106
-
107
-
108
-
109
-
110
-
111
-
112
-
113
-
114
-
115
-
116
-
117
-
118
-
119
-
120
-
121
-
122
-
123
-
124
-
125
-
126
-
127
-
128
-
129
-
130
-
131
-
132
 |
 |

Shurgard Europe also experienced similar economic conditions and reduced demand,
resulting in lower 2009 Same Store revenue and NOI. Steven De Tollenaere, Shurgard
Europe’s Chief Executive Officer, and his management team deployed similar strategies of
reducing asking rates, increasing promotional discounts and increasing media spend to
drive move-in activity. Shurgard Europe started 2009 at 84.7% occupancy, about 4%
behind 2008 (a big gap!) and with significantly lower “asking rents.” By year end,
occupancies had been restored to 85.7% and asking rents were higher. In 2010, we expect
positive revenue and NOI comparisons for the European portfolio.
Commercial Properties
Our investment in commercial properties consists of our 41% equity interest in PSB and
our wholly owned properties, which are generally contiguous to our self-storage properties.
We own approximately one million square feet directly and another nine million square feet
indirectly through our investment in PSB.
The Same Store performance metrics used for self-storage are applicable to commercial
properties. Reduced business activity and customer failures in 2009 negatively impacted
our commercial properties’ operating performance. PSB was able to restore some of the
occupancy loss with aggressive leasing, but in-place rents have declined due to lower asking
rents.
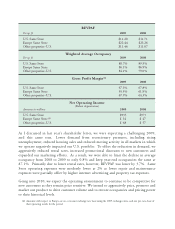
Commercial Property
REVPAF / Gross Profit Margin / Occupancy(5)
2009 2008
REVPAF (Per sq. ft.) $13.67 $14.18
Gross profit margin(3) 67.8% 68.4%
Weighted average occupancy (Per sq. ft.) 89.9% 92.1%
Operating Cash Flow(6)
Amounts in millions 2009 2008
PS Business Parks $56 $58
Public Storage 9 9
Operating earnings 65 67
Capital expenditures, tenant improvements, and lease commissions (12) (15)
Operating cash flow $53 $52
(5) Same Store facilities.
(6) Reflects Public Storage’s pro rata share of PS Business Parks and wholly owned Public Storage properties.