Public Storage 2009 Annual Report Download - page 6
Download and view the complete annual report
Please find page 6 of the 2009 Public Storage annual report below. You can navigate through the pages in the report by either clicking on the pages listed below, or by using the keyword search tool below to find specific information within the annual report.-
 1
1 -
 2
2 -
 3
3 -
 4
4 -
 5
5 -
 6
6 -
 7
7 -
 8
8 -
 9
9 -
 10
10 -
 11
11 -
 12
12 -
 13
13 -
 14
14 -
 15
15 -
 16
16 -
 17
17 -
18
-
19
-
20
-
21
-
22
-
23
-
24
-
25
-
26
-
27
-
28
-
29
-
30
-
31
-
32
-
33
-
34
-
35
-
36
-
37
-
38
-
39
-
40
-
41
-
42
-
43
-
44
-
45
-
46
-
47
-
48
-
49
-
50
-
51
-
52
-
53
-
54
-
55
-
56
-
57
-
58
-
59
-
60
-
61
-
62
-
63
-
64
-
65
-
66
-
67
-
68
-
69
-
70
-
71
-
72
-
73
-
74
-
75
-
76
-
77
-
78
-
79
-
80
-
81
-
82
-
83
-
84
-
85
-
86
-
87
-
88
-
89
-
90
-
91
-
92
-
93
-
94
-
95
-
96
-
97
-
98
-
99
-
100
-
101
-
102
-
103
-
104
-
105
-
106
-
107
-
108
-
109
-
110
-
111
-
112
-
113
-
114
-
115
-
116
-
117
-
118
-
119
-
120
-
121
-
122
-
123
-
124
-
125
-
126
-
127
-
128
-
129
-
130
-
131
-
132
 |
 |

Businesses
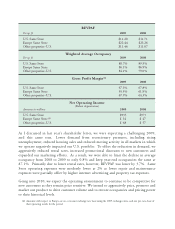
As reflected in the following table, operating earnings(2) were down from $1.24 billion in
2008 to $1.20 billion in 2009, or about 4%.
Operating Earnings(2)
Amounts in millions 2009 2008
U.S. self-storage operations $1,006 $1,034
European self-storage operations 66 84
Commercial properties 65 67
Ancillary operations 62 59
Operating earnings $1,199 $1,244
Self-Storage Operations
When evaluating our store operations, we bifurcate our domestic and European properties
into two groups–“Same Store” and other.
Same Store properties have been operated by the Company for the last three years at a
stabilized occupancy level. “Other” properties have been recently acquired or developed or
are being redeveloped. We consider the measurement of Same Store operations a key
barometer of both the fundamental strength of our business and the efficacy of our
personnel and operating strategies.
We use certain metrics to evaluate our performance, the most important being revenue
per available square feet, or “REVPAF,” and gross profit margin.(3) REVPAF measures
how much revenue is generated per foot we have available for lease. To manage growth
in REVPAF, we balance increased pricing with higher customer volumes (occupancy).
Also impacting REVPAF are product quality, customer sales and service, local
competition and the local economy. Gross profit margin is a function of our success at
generating more revenue while controlling expenses. Due to 2009’s challenging economic
conditions, both REVPAF and gross profit margin declined across the Same Store
portfolio in the U.S. and Europe, resulting in lower net operating income.
(2) See accompanying schedule “Supplemental Non-GAAP Disclosures” for a definition.
(3) Gross profit margin is the ratio of property net operating income before depreciation divided by total revenues.