Public Storage 2009 Annual Report Download - page 3
Download and view the complete annual report
Please find page 3 of the 2009 Public Storage annual report below. You can navigate through the pages in the report by either clicking on the pages listed below, or by using the keyword search tool below to find specific information within the annual report.-
 1
1 -
 2
2 -
 3
3 -
 4
4 -
 5
5 -
 6
6 -
 7
7 -
 8
8 -
 9
9 -
 10
10 -
 11
11 -
 12
12 -
 13
13 -
 14
14 -
15
-
16
-
17
-
18
-
19
-
20
-
21
-
22
-
23
-
24
-
25
-
26
-
27
-
28
-
29
-
30
-
31
-
32
-
33
-
34
-
35
-
36
-
37
-
38
-
39
-
40
-
41
-
42
-
43
-
44
-
45
-
46
-
47
-
48
-
49
-
50
-
51
-
52
-
53
-
54
-
55
-
56
-
57
-
58
-
59
-
60
-
61
-
62
-
63
-
64
-
65
-
66
-
67
-
68
-
69
-
70
-
71
-
72
-
73
-
74
-
75
-
76
-
77
-
78
-
79
-
80
-
81
-
82
-
83
-
84
-
85
-
86
-
87
-
88
-
89
-
90
-
91
-
92
-
93
-
94
-
95
-
96
-
97
-
98
-
99
-
100
-
101
-
102
-
103
-
104
-
105
-
106
-
107
-
108
-
109
-
110
-
111
-
112
-
113
-
114
-
115
-
116
-
117
-
118
-
119
-
120
-
121
-
122
-
123
-
124
-
125
-
126
-
127
-
128
-
129
-
130
-
131
-
132
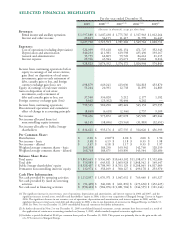
 |
 |

For the year ended December 31,
2009 2008(1)(2) 2007(1)(2) 2006(1)(2) 2005(2)
(Amounts in thousands, except per share data)
Revenues:
Rental income and ancillary operations $ 1,597,889 $ 1,687,438 $ 1,775,785 $ 1,317,963 $ 1,012,264
Interest and other income 29,813 36,155 11,417 31,799 16,447
1,627,702 1,723,593 1,787,202 1,349,762 1,028,711
Expenses:
Cost of operations (excluding depreciation) 522,939 555,618 631,154 471,725 352,343
Depreciation and amortization 340,233 411,981 619,598 435,496 193,167
General and administrative 35,735 62,809 59,749 84,661 21,115
Interest expense 29,916 43,944 63,671 33,062 8,216
928,823 1,074,352 1,374,172 1,024,944 574,841
Income from continuing operations before
equity in earnings of real estate entities,
gain (loss) on disposition of real estate
investments, gain on early retirement of
debt, casualty gain or loss, and foreign
currency exchange gain (loss), net 698,879 649,241 413,030 324,818 453,870
Equity in earnings of real estate entities 53,244 20,391 12,738 11,895 24,883
Gain on disposition of real estate
investments, early retirement of
debt and casualty gain or loss, net 37,540 336,020 5,212 2,177 1,182
Foreign currency exchange gain (loss) 9,662 (25,362) 58,444 4,262 —
Income from continuing operations 799,325 980,290 489,424 343,152 479,935
Discontinued operations and cumulative
effect of change in accounting principle (8,869) (6,418) (2,346) 2,757 9,109
Net income 790,456 973,872 487,078 345,909 489,044
Net income allocated from (to)
noncontrolling equity interests 44,165 (38,696) (29,543) (31,883) (32,651)
Net income allocable to Public Storage
shareholders $ 834,621 $ 935,176 $ 457,535 $ 314,026 $ 456,393
Per Common Share:
Distributions $ 2.20 $ 2.80(3)$ 2.00 $ 2.00 $ 1.90
Net income - basic $ 3.48 $ 4.19 $ 1.18 $ 0.33 $ 1.98
Net income - diluted $ 3.47 $ 4.18 $ 1.17 $ 0.33 $ 1.97
Weighted average common shares - basic 168,358 168,250 169,342 142,760 128,159
Weighted average common shares - diluted 168,768 168,675 169,850 143,344 128,686
Balance Sheet Data:
Total assets $ 9,805,645 $ 9,936,045 $10,643,102 $11,198,473 $ 5,552,486
Total debt $ 518,889 $ 643,811 $ 1,069,928 $ 1,848,542 $ 149,647
Public Storage shareholders’ equity $ 8,928,407 $ 8,708,995 $ 8,763,129 $ 8,208,045 $ 4,817,009
Permanent noncontrolling interests’ equity $ 132,974 $ 358,109 $ 500,127 $ 499,178 $ 253,970
Cash Flow Information:
Net cash provided by operating activities $ 1,112,857 $ 1,076,971 $ 1,047,652 $ 769,440 $ 691,327
Net cash provided by (used in) investing
activities $ (91,409) $ 340,018 $ (261,876) $ (473,630) $ (452,425)
Net cash used in financing activities $ (938,401) $ (984,076) $ (1,081,504) $ (244,395) $ (121,146)
SELECTED FINANCIAL HIGHLIGHTS
(1) The significant increase in our revenues, cost of operations, depreciation and amortization, and interest expense in 2006 and 2007, and the
significant increase in total assets, total debt and shareholders’ equity in 2006, is due to our acquisition of Shurgard Storage Centers in August
2006. The significant decrease in our revenues, cost of operations, depreciation and amortization, and interest expense in 2008, and the
significant decrease in total assets, total debt and other equity in 2008, is due to our disposition of an interest in Shurgard Europe on March 31,
2008. See Note 3 to our December 31, 2009 consolidated financial statements for further information.
(2) As further discussed in Note 2 to our December 31, 2009 consolidated financial statements, certain amounts have been restated as a result of
the application of certain new accounting standards on January 1, 2009, which standards required retroactive application.
(3) Includes a special dividend of $0.60 per common share paid on December 30, 2008. This payout was primarily due to the gain on the sale
of a 51% interest in Shurgard Europe.