Public Storage 2009 Annual Report Download - page 15
Download and view the complete annual report
Please find page 15 of the 2009 Public Storage annual report below. You can navigate through the pages in the report by either clicking on the pages listed below, or by using the keyword search tool below to find specific information within the annual report.-
 1
1 -
2
-
3
-
4
-
 5
5 -
 6
6 -
 7
7 -
 8
8 -
 9
9 -
 10
10 -
 11
11 -
 12
12 -
 13
13 -
 14
14 -
 15
15 -
 16
16 -
 17
17 -
 18
18 -
 19
19 -
 20
20 -
 21
21 -
 22
22 -
 23
23 -
 24
24 -
 25
25 -
26
-
27
-
28
-
29
-
30
-
31
-
32
-
33
-
34
-
35
-
36
-
37
-
38
-
39
-
40
-
41
-
42
-
43
-
44
-
45
-
46
-
47
-
48
-
49
-
50
-
51
-
52
-
53
-
54
-
55
-
56
-
57
-
58
-
59
-
60
-
61
-
62
-
63
-
64
-
65
-
66
-
67
-
68
-
69
-
70
-
71
-
72
-
73
-
74
-
75
-
76
-
77
-
78
-
79
-
80
-
81
-
82
-
83
-
84
-
85
-
86
-
87
-
88
-
89
-
90
-
91
-
92
-
93
-
94
-
95
-
96
-
97
-
98
-
99
-
100
-
101
-
102
-
103
-
104
-
105
-
106
-
107
-
108
-
109
-
110
-
111
-
112
-
113
-
114
-
115
-
116
-
117
-
118
-
119
-
120
-
121
-
122
-
123
-
124
-
125
-
126
-
127
-
128
-
129
-
130
-
131
-
132
 |
 |

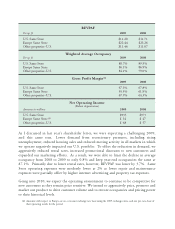
With financing close to unavailable and property income declining, capitalization rates
have increased and transaction volume has declined.
Conclusion
Today’s unemployment rate of 10% plus in many markets will result in challenging operating
conditions for owners of commercial real estate during 2010 and possibly into 2011. Declining
property NOIs will continue to impede private owners’ ability both to refinance existing debt and to
leverage up to fund acquisitions.
Public real estate companies have demonstrated an uncanny ability to raise “rescue capital,”
similar to many commercial banks. Last year, REITs raised $24 billion of new common equity
capital, the most since 1997. With new equity capital, REITs can usually refinance existing
obligations on reasonable terms.
In 2009, we purchased no properties. However, with over a $1 trillion of commercial real estate
debt coming due in the next five years, much of which was put in place to fund acquisitions
“at the peak,” there should be abundant opportunity for prudent acquisitions. As the previous
chart reflects, transaction volume is down significantly along with values (rising cap rates). We
have gone from euphoria to fear in the commercial real estate market, and as Warren Buffett
says, “A climate of fear is the best friend for investing.”
2001 2002 2003 2004 2005 2006 2007 2008 2009
Transaction Volume Avg Cap Rate($ billions)
$80
$60
$40
$20
$0
Real Estate Cap Rates vs. Transaction Volumes
2001 - 2009
Due to the aggressive buying and selling activity from cheap capital, commercial real estate cap
rates fell to its lowest point in 2006-2007 but have been rising ever since. Limited capital,
especially from CMBS, has significantly impacted transaction volume.
Source: Real Capital Analytics
10.0%
9.0%
8.0%
7.0%
6.0%
5.0%