Public Storage 2009 Annual Report Download - page 12
Download and view the complete annual report
Please find page 12 of the 2009 Public Storage annual report below. You can navigate through the pages in the report by either clicking on the pages listed below, or by using the keyword search tool below to find specific information within the annual report.-
 1
1 -
 2
2 -
 3
3 -
 4
4 -
 5
5 -
 6
6 -
 7
7 -
 8
8 -
 9
9 -
 10
10 -
 11
11 -
 12
12 -
 13
13 -
 14
14 -
 15
15 -
 16
16 -
 17
17 -
 18
18 -
 19
19 -
 20
20 -
 21
21 -
 22
22 -
23
-
24
-
25
-
26
-
27
-
28
-
29
-
30
-
31
-
32
-
33
-
34
-
35
-
36
-
37
-
38
-
39
-
40
-
41
-
42
-
43
-
44
-
45
-
46
-
47
-
48
-
49
-
50
-
51
-
52
-
53
-
54
-
55
-
56
-
57
-
58
-
59
-
60
-
61
-
62
-
63
-
64
-
65
-
66
-
67
-
68
-
69
-
70
-
71
-
72
-
73
-
74
-
75
-
76
-
77
-
78
-
79
-
80
-
81
-
82
-
83
-
84
-
85
-
86
-
87
-
88
-
89
-
90
-
91
-
92
-
93
-
94
-
95
-
96
-
97
-
98
-
99
-
100
-
101
-
102
-
103
-
104
-
105
-
106
-
107
-
108
-
109
-
110
-
111
-
112
-
113
-
114
-
115
-
116
-
117
-
118
-
119
-
120
-
121
-
122
-
123
-
124
-
125
-
126
-
127
-
128
-
129
-
130
-
131
-
132
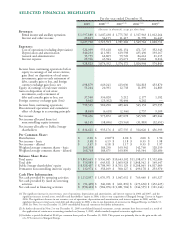
 |
 |

Moving activity, which had been relatively stable, began slowing in 2007. The percentage
of Americans moving declined to 12% in 2008, down from 14% in 2006. The number of
people moving in 2008 was the lowest since 1962, when the U.S. had 180 million people,
as compared to over 300 million today.
Total U.S. Movers in 000’s Moving asa%ofTotal U.S. Population
50,000
40,000
30,000
20,000
10,000
0
18.0%
16.0%
14.0%
12.0%
10.0%
2000 2001 2002 2003 2004 2005 2006 2007 2008
U.S. Population Mobility Rates
2000 - 2009
16%
14%
15% 14% 14% 14% 14% 13%
12%
Moving activity in 2008 was the lowest since 1962.
Source: U.S. Census
43,888
39,007 41,111 40,093 38,995 39,888 39,837 38,681
35,167
2000 2001 2002 2003 2004 2005 2006 2007 2008 2009
U.S. Unemployment Rate
2000 - 2009
Source: U.S. Labor Department
As the U.S. economy slipped into a recession, unemployment began rising and added to the slow
down in demand impacting moving activity.
13.0%
11.0%
9.0%
7.0%
5.0%
3.0%
10%
4%