Public Storage 2007 Annual Report Download - page 9
Download and view the complete annual report
Please find page 9 of the 2007 Public Storage annual report below. You can navigate through the pages in the report by either clicking on the pages listed below, or by using the keyword search tool below to find specific information within the annual report.-
 1
1 -
 2
2 -
 3
3 -
 4
4 -
 5
5 -
 6
6 -
 7
7 -
 8
8 -
 9
9 -
 10
10 -
 11
11 -
 12
12 -
 13
13 -
 14
14 -
 15
15 -
 16
16 -
 17
17 -
 18
18 -
 19
19 -
 20
20 -
21
-
22
-
23
-
24
-
25
-
26
-
27
-
28
-
29
-
30
-
31
-
32
-
33
-
34
-
35
-
36
-
37
-
38
-
39
-
40
-
41
-
42
-
43
-
44
-
45
-
46
-
47
-
48
-
49
-
50
-
51
-
52
-
53
-
54
-
55
-
56
-
57
-
58
-
59
-
60
-
61
-
62
-
63
-
64
-
65
-
66
-
67
-
68
-
69
-
70
-
71
-
72
-
73
-
74
-
75
-
76
-
77
-
78
-
79
-
80
-
81
-
82
-
83
-
84
-
85
-
86
-
87
-
88
-
89
-
90
-
91
-
92
-
93
-
94
-
95
-
96
-
97
-
98
-
99
-
100
-
101
-
102
-
103
-
104
-
105
-
106
-
107
-
108
-
109
-
110
-
111
-
112
-
113
-
114
-
115
-
116
-
117
-
118
-
119
-
120
-
121
-
122
-
123
-
124
-
125
-
126
-
127
-
128
-
129
-
130
-
131
-
132
-
133
-
134
-
135
-
136
-
137
-
138
-
139
-
140
-
141
-
142
-
143
-
144
-
145
-
146
-
147
-
148
-
149
-
150
-
151
-
152
-
153
-
154
-
155
-
156
 |
 |

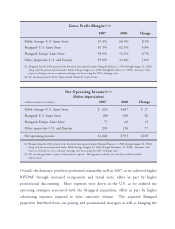
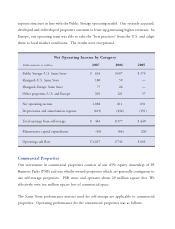
expense structure in line with the Public Storage operating model. Our recently acquired,
developed and redeveloped properties continue to lease-up generating higher revenues. In
Europe, our operating team was able to take the “best practices” from the U.S. and adapt
them to local market conditions. The results were exceptional.
Net Operating Income by Category
Dollar amounts in millions 2007 2006 2005
Public Storage–U.S. Same Store $ 624 $ 607 $ 574
Shurgard–U.S. Same Store 180 59 —
Shurgard–Europe Same Store 77 24 —
Other properties–U.S. and Europe 201 121 57
Net operating income 1,082 811 631
Depreciation and amortization expense (619) (434) (191)
Total earnings from self-storage $ 463 $ 377 $ 440
Maintenance capital expenditures (65) (66) (26)
Operating cash flow $1,017 $ 745 $ 605
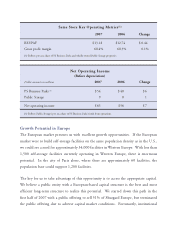
Commercial Properties
Our investment in commercial properties consists of our 45% equity ownership of PS
Business Parks (PSB) and our wholly-owned properties which are generally contiguous to
our self-storage properties. PSB owns and operates about 20 million square feet. We
effectively own ten million square feet of commercial space.
The Same Store performance metrics used for self-storage are applicable to commercial
properties. Operating performance for the commercial properties was as follows.