Public Storage 2007 Annual Report Download - page 2
Download and view the complete annual report
Please find page 2 of the 2007 Public Storage annual report below. You can navigate through the pages in the report by either clicking on the pages listed below, or by using the keyword search tool below to find specific information within the annual report.-
 1
1 -
 2
2 -
 3
3 -
 4
4 -
 5
5 -
 6
6 -
 7
7 -
 8
8 -
 9
9 -
 10
10 -
 11
11 -
 12
12 -
 13
13 -
14
-
15
-
16
-
17
-
18
-
19
-
20
-
21
-
22
-
23
-
24
-
25
-
26
-
27
-
28
-
29
-
30
-
31
-
32
-
33
-
34
-
35
-
36
-
37
-
38
-
39
-
40
-
41
-
42
-
43
-
44
-
45
-
46
-
47
-
48
-
49
-
50
-
51
-
52
-
53
-
54
-
55
-
56
-
57
-
58
-
59
-
60
-
61
-
62
-
63
-
64
-
65
-
66
-
67
-
68
-
69
-
70
-
71
-
72
-
73
-
74
-
75
-
76
-
77
-
78
-
79
-
80
-
81
-
82
-
83
-
84
-
85
-
86
-
87
-
88
-
89
-
90
-
91
-
92
-
93
-
94
-
95
-
96
-
97
-
98
-
99
-
100
-
101
-
102
-
103
-
104
-
105
-
106
-
107
-
108
-
109
-
110
-
111
-
112
-
113
-
114
-
115
-
116
-
117
-
118
-
119
-
120
-
121
-
122
-
123
-
124
-
125
-
126
-
127
-
128
-
129
-
130
-
131
-
132
-
133
-
134
-
135
-
136
-
137
-
138
-
139
-
140
-
141
-
142
-
143
-
144
-
145
-
146
-
147
-
148
-
149
-
150
-
151
-
152
-
153
-
154
-
155
-
156
 |
 |

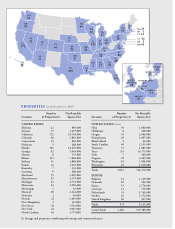
Number Net Rentable
Location of Properties(1) Square Feet
UNITED STATES
Alabama 22 890,000
Arizona 37 2,259,000
California 372 23,764,000
Colorado 60 3,810,000
Connecticut 14 869,000
Delaware 5 288,000
Florida 191 12,470,000
Georgia 92 5,964,000
Hawaii 8 555,000
Illinois 123 7,800,000
Indiana 31 1,880,000
Kansas 22 1,310,000
Kentucky 7 330,000
Louisiana 9 608,000
Maryland 55 3,185,000
Massachusetts 19 1,179,000
Michigan 43 2,755,000
Minnesota 44 2,990,000
Mississippi 1 63,000
Missouri 38 2,144,000
Nebraska 1 46,000
Nevada 22 1,404,000
New Hampshire 2 132,000
New Jersey 56 3,524,000
New York 62 3,967,000
North Carolina 69 4,775,000
(1) Storage and properties combining self-storage and commercial space.
Number Net Rentable
Location of Properties(1) Square Feet
UNITED STATES (cont.)
Ohio 30 1,860,000
Oklahoma 8 428,000
Oregon 39 2,006,000
Pennsylvania 28 1,867,000
Rhode Island 2 64,000
South Carolina 40 2,155,000
Tennessee 33 1,883,000
Texas 235 15,375,000
Utah 7 440,000
Virginia 78 4,407,000
Washington 91 5,998,000
Wisconsin 16 1,030,000
Totals 2,012 126,474,000
EUROPE
Belgium 21 1,219,000
Denmark 10 502,000
France 53 2,776,000
Germany 11 550,000
Netherlands 33 1,749,000
Sweden 26 1,372,000
United Kingdom 20 947,000
Totals 174 9,115,000
Grand Totals 2,186 135,589,000
PROPERTIES (as of December 31, 2007)
WA
OR
CA
NV
UT
AZ
HI
CO
NE
KS
OK
TX LA
MO
MN
WI
IL IN OH
MI
KY
TN
AL
MS GA
SC
NC
VA
PA
NY
NH
MA
RI
CT
NJ
DE
MD
FL
91
39
372
22
7
37
8
60
1
22
8
235 9
38
44
16
123 31 30
43
7
33
221 92
40
69
78
28
62
2
2
19
14
5
56
55
191
UNITED
KINGDOM
FRANCE
GERMANY
NETHERLANDS
BELGIUM
DENMARK
SWEDEN
20
53
11
33
21
10
26