Public Storage 2007 Annual Report Download - page 7
Download and view the complete annual report
Please find page 7 of the 2007 Public Storage annual report below. You can navigate through the pages in the report by either clicking on the pages listed below, or by using the keyword search tool below to find specific information within the annual report.-
 1
1 -
 2
2 -
 3
3 -
 4
4 -
 5
5 -
 6
6 -
 7
7 -
 8
8 -
 9
9 -
 10
10 -
 11
11 -
 12
12 -
 13
13 -
 14
14 -
 15
15 -
 16
16 -
 17
17 -
 18
18 -
19
-
20
-
21
-
22
-
23
-
24
-
25
-
26
-
27
-
28
-
29
-
30
-
31
-
32
-
33
-
34
-
35
-
36
-
37
-
38
-
39
-
40
-
41
-
42
-
43
-
44
-
45
-
46
-
47
-
48
-
49
-
50
-
51
-
52
-
53
-
54
-
55
-
56
-
57
-
58
-
59
-
60
-
61
-
62
-
63
-
64
-
65
-
66
-
67
-
68
-
69
-
70
-
71
-
72
-
73
-
74
-
75
-
76
-
77
-
78
-
79
-
80
-
81
-
82
-
83
-
84
-
85
-
86
-
87
-
88
-
89
-
90
-
91
-
92
-
93
-
94
-
95
-
96
-
97
-
98
-
99
-
100
-
101
-
102
-
103
-
104
-
105
-
106
-
107
-
108
-
109
-
110
-
111
-
112
-
113
-
114
-
115
-
116
-
117
-
118
-
119
-
120
-
121
-
122
-
123
-
124
-
125
-
126
-
127
-
128
-
129
-
130
-
131
-
132
-
133
-
134
-
135
-
136
-
137
-
138
-
139
-
140
-
141
-
142
-
143
-
144
-
145
-
146
-
147
-
148
-
149
-
150
-
151
-
152
-
153
-
154
-
155
-
156
 |
 |

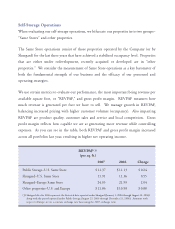
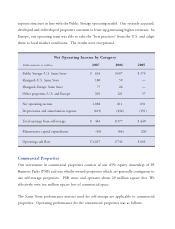
Self-Storage Operations
When evaluating our self-storage operations, we bifurcate our properties into two groups–
“Same Stores” and other properties.
The Same Store operations consist of those properties operated by the Company (or by
Shurgard) for the last three years that have achieved a stabilized occupancy level. Properties
that are either under redevelopment, recently acquired or developed are in “other
properties.” We consider the measurement of Same Store operations as a key barometer of
both the fundamental strength of our business and the efficacy of our personnel and
operating strategies.
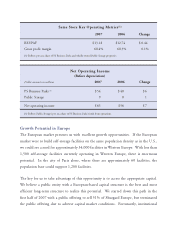
We use certain metrics to evaluate our performance, the most important being revenue per
available square foot, or “REVPAF,” and gross profit margin. REVPAF measures how
much revenue is generated per foot we have to sell. We manage growth in REVPAF,
balancing increased pricing with higher customer volumes (occupancy). Also impacting
REVPAF are product quality, customer sales and service and local competition. Gross
profit margin reflects how capable we are at generating more revenue while controlling
expenses. As you can see in the table, both REVPAF and gross profit margin increased
across all portfolios last year, resulting in higher net operating income.
REVPAF(1)
(per sq. ft.)
2007 2006 Change
Public Storage–U.S. Same Store $ 11.37 $ 11.13 $ 0.24
Shurgard–U.S. Same Store 11.91 11.36 0.55
Shurgard–Europe Same Store 24.03 21.99 2.04
Other properties–U.S. and Europe $ 11.86 $ 10.98 $ 0.88
(1) Shurgard data for 2006 represents the historical data operated under Shurgard (January 1, 2006 through August 22, 2006)
along with the period operated under Public Storage (August 23, 2006 through December 31, 2006). Amounts with
respect to Europe are on a constant exchange rate basis using the 2007 exchange ratio.