Public Storage 2006 Annual Report Download - page 3
Download and view the complete annual report
Please find page 3 of the 2006 Public Storage annual report below. You can navigate through the pages in the report by either clicking on the pages listed below, or by using the keyword search tool below to find specific information within the annual report.-
 1
1 -
 2
2 -
 3
3 -
 4
4 -
 5
5 -
 6
6 -
 7
7 -
 8
8 -
 9
9 -
 10
10 -
 11
11 -
 12
12 -
 13
13 -
 14
14 -
15
-
16
-
17
-
18
-
19
-
20
-
21
-
22
-
23
-
24
-
25
-
26
-
27
-
28
-
29
-
30
-
31
-
32
-
33
-
34
-
35
-
36
-
37
-
38
-
39
-
40
-
41
-
42
-
43
-
44
-
45
-
46
-
47
-
48
-
49
-
50
-
51
-
52
-
53
-
54
-
55
-
56
-
57
-
58
-
59
-
60
-
61
-
62
-
63
-
64
-
65
-
66
-
67
-
68
-
69
-
70
-
71
-
72
-
73
-
74
-
75
-
76
-
77
-
78
-
79
-
80
-
81
-
82
-
83
-
84
-
85
-
86
-
87
-
88
-
89
-
90
-
91
-
92
-
93
-
94
-
95
-
96
-
97
-
98
-
99
-
100
-
101
-
102
-
103
-
104
-
105
-
106
-
107
-
108
-
109
-
110
-
111
-
112
-
113
-
114
-
115
-
116
-
117
-
118
-
119
-
120
-
121
-
122
-
123
-
124
-
125
-
126
-
127
-
128
-
129
-
130
-
131
-
132
-
133
-
134
-
135
-
136
-
137
-
138
-
139
-
140
-
141
-
142
-
143
-
144
-
145
-
146
-
147
-
148
-
149
-
150
-
151
-
152
 |
 |

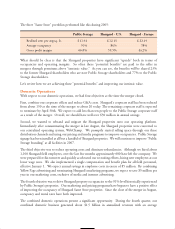
For t
h
e year en
d
e
d
Decem
b
er 31
,
2006
(
1
)
2
00
5
(
1
)
2
004
(
1
)
2
00
3
(
1
)
2
00
2
(
1
)
(
Amounts in thousands, except per share data
)
R
even
u
es:
R
ental income and ancillary operations
$
$
1,043,600
$
952,766
$
890,350
$
845,27
3
1
,349,856
Interest and other income 31,799 16,447 5,391 2,537 5,210
31,799
Total Revenues 1,381,655 1,060,047 958,157 892,887 850,483
1,381,655
E
xpenses
:
Cost of operations 500,560 378,301 361,944 340,871 309,491
500,560
Depreciation and amortization 437,984 196,232 182,890 183,863 175,524
437,984
General and administrative 84,661 21,115 18,813 17,127 15,619
84,661
Interest expense 33,062 8,216 760 1,121 3,809
33,062
603,864 564,407 542,982 504,44
3
1
,056,267
Income from continuin
g
operations before
equity in earnin
g
s o
f
rea
l
estate entities,
m
i
nor
i
t
y
i
nterest in income an
d
ot
h
e
r
456,183 393,750 349,905 346,04
0
325,388
Equity in earnings of real estate entities 11,895 24,883 22,564 24,966 29,888
11,895
Other 6,439 1,182 67 1,007 (2,541)
6,439
Minority interest in income (31,883) (32,651) (49,913) (43,703) (44,087)
(31,883)
Income from continuing operations 311,839 449,597 366,468 332,175 329,300
311,839
C
umu
l
ative e
ff
ect o
f
c
h
ange in accounting
principle 578 — — — —
578
Discontinued operations (2) 1,609 6,796 (255) 4,478 (10,562)
1,609
Net income $ 314,026 $ 456,393 $ 366,213 $ 336,653 $ 318,738
$
314,026
Net income allocable to common shareholders
$
$ 254,395 $ 178,063 $ 161,836 $ 141,42346,891
Per
C
ommon
Sh
are
:
Distributions $ 2.00 $ 1.90 $ 1.80 $ 1.80 $ 1.80
$
2.00
Net income - diluted $ 0.33 $ 1.97 $ 1.38 $ 1.28 $ 1.14
$
0.33
Weighted average common shares - diluted 143,715 128,819 128,681 126,517 124,571
143,715
B
alance Sheet Data
:
Total assets $ 11,198,473 $ 5,552,486 $ 5,204,790 $ 4,968,069 $4,843,662
$
11,198,473
Total debt $ 1,848,542 $ 149,647 $ 145,614 $ 76,030 $ 115,867
$
1,848,542
Minority interest (other
p
artnershi
p
interests) $$ 28,970 $ 118,903 $ 141,137 $ 154,499181,030
Minority interest (
p
referred
p
artnershi
p
interests)
$
$ 225,000 $ 310,000 $ 285,000 $ 285,00
0
325,000
Shareholders’ equity $ 8,208,045 $ 4,817,009 $ 4,429,967 $ 4,219,799 $4,158,969
$ 8,208,045
O
ther Data:
Net cash provided by operating activities $ 791,700 $ 692,048 $ 616,664 $ 571,387 $ 591,283
$
791,700
Net cash used in investing activities $ (487,496) $ (443,656) $ (157,638) $ (205,133) $ (325,786)
$
(487,496)
Net cash used in financing activities $ (244,395) $ (121,146) $ (297,604) $ (264,545) $ (211,720)
$
(244,395)
S
ELECTED FINANCIAL HIGHLIGHT
S
(
1) During 2006, 2005, 2004, 2003 and 2002, we completed several significant asset acquisitions, business combinations and equ
i
t
y
t
ransactions. See our conso
l
i
d
ate
d
f
inancia
l
statements an
d
notes t
h
ereto.
(
2) Commencing January 1, 2002, we adopted and modified a business plan that included the closure or consolidation of certain non-
strate
g
ic containerize
d
stora
g
e
f
aci
l
ities. We so
ld
two commercia
l
p
ro
p
erties—one in 2002, t
h
e ot
h
er in 2004. Durin
g
2003, we
sold five self-storage facilities. The historical operations of these facilities are classified as discontinued operations, w
i
th
the
rental
income, cost o
f
o
p
erations,
d
e
p
reciation ex
p
ense an
d
g
ain or
l
oss on
d
is
p
osition o
f
t
h
ese
f
aci
l
ities
f
or current an
d
p
rior
p
erio
ds
included in the line item “Discontinued Operations” on the consolidated income statement.