Public Storage 2006 Annual Report Download - page 14
Download and view the complete annual report
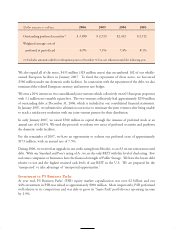
Please find page 14 of the 2006 Public Storage annual report below. You can navigate through the pages in the report by either clicking on the pages listed below, or by using the keyword search tool below to find specific information within the annual report.
F
or t
h
e year en
d
e
d
Decem
b
er 31
,
(Amounts in t
h
ousan
d
s, except per s
h
are amounts)
2
006 2005 2004
Net income:
$
314,026
$
456,393
$
366,213
De
p
reciation and amortization 437,984 196,232 183,06
3
Depreciation and amortization included in
d
iscontinued operations 234 253
1,282
L
ess -
d
e
p
reciation wit
h
res
p
ect to non-rea
l
estate assets
(
225) (1,789) (
4
,252
)
De
p
reciation
f
rom unconso
l
i
d
ate
d
rea
l
estate investment
s
38,890 35,425 33,72
0
G
ain on sale of real estate assets
(
4,547
)(
8,279
)(
2,288
)
L
ess - our share of gain on sale of real estate include
d
in equity o
f
earnings o
f
rea
l
estate entities (1,047) (7,858) (6,715
)
Minority interest s
h
are o
f
income 31,883 32,651 49,91
3
Net cas
h
provi
d
e
d
b
y operating activities 817,198 703,028 620,936
F
FO to minority interest - common (17,312) (18,782) (23,473
)
F
FO to minority interest -
p
referred (19,055) (17,021) (32,486
)
F
un
d
s
f
rom operations 780,831 667,225 564,97
7
L
ess: a
ll
ocations to
p
re
f
erre
d
an
d
e
q
uity stoc
k
s
h
are
h
o
ld
ers:
S
enior Preferred
(
245,711
)(
180,555
)(
166,649
)
Equity Stock, Series A (21,424) (21,443) (21,501
)
F
FO allocable to our common shareholders $513
,
696 $465
,
227 $376
,
827
W
eighted average shares outstanding:
C
ommon s
h
ares 142
,
760 128
,
159 127
,
836
S
toc
k
o
p
tion
d
i
l
ution 955 660 84
5
W
eighted average common shares for purposes o
f
computing fully-diluted FFO per common share 143,715 128,819 128,68
1
F
FO
p
er common share $ 3.57 $ 3.61 $ 2.93
Com
p
utation o
f
Fun
d
s
f
rom O
p
erations (unau
d
ite
d
)
Fun
d
s
f
rom operations (“FFO”) is a term
d
e
f
ine
d
b
y t
h
e Nationa
l
Association o
f
Rea
l
Estate Investment
Trusts (“NAREIT”). FFO is a supp
l
ementa
l
non-GAAP
f
inancia
l
d
isc
l
osure, an
d
it is
g
enera
ll
y
d
e
f
ine
d
as net income before depreciation and gains and losses on real estate assets. FFO is presented becaus
e
m
anagement an
d
many ana
l
ysts consi
d
er FFO to
b
e one measure o
f
t
h
e per
f
ormance o
f
rea
l
estate
c
om
p
anies an
d
b
ecause we
b
e
l
ieve t
h
at FFO is
h
e
lpf
u
l
to investors as an a
dd
itiona
l
measure o
f
t
he
performance of a REIT. FFO computations do not consider scheduled principal payments on debt
,
c
apita
l
improvements,
d
istri
b
ution an
d
ot
h
er o
bl
igations o
f
t
h
e Company. FFO is not a su
b
stitute
f
or
our cas
h
fl
ow or net income as a measure o
f
our
l
iqui
d
ity or operatin
g
per
f
ormance or our a
b
i
l
ity to pay
dividends. Other REITs may not compute FFO in the same manner; accordingly, FFO may not be
c
ompara
bl
e among REITs.


