Public Storage 2006 Annual Report Download - page 10
Download and view the complete annual report
Please find page 10 of the 2006 Public Storage annual report below. You can navigate through the pages in the report by either clicking on the pages listed below, or by using the keyword search tool below to find specific information within the annual report.-
 1
1 -
 2
2 -
 3
3 -
 4
4 -
 5
5 -
 6
6 -
 7
7 -
 8
8 -
 9
9 -
 10
10 -
 11
11 -
 12
12 -
 13
13 -
 14
14 -
 15
15 -
 16
16 -
 17
17 -
 18
18 -
 19
19 -
 20
20 -
 21
21 -
22
-
23
-
24
-
25
-
26
-
27
-
28
-
29
-
30
-
31
-
32
-
33
-
34
-
35
-
36
-
37
-
38
-
39
-
40
-
41
-
42
-
43
-
44
-
45
-
46
-
47
-
48
-
49
-
50
-
51
-
52
-
53
-
54
-
55
-
56
-
57
-
58
-
59
-
60
-
61
-
62
-
63
-
64
-
65
-
66
-
67
-
68
-
69
-
70
-
71
-
72
-
73
-
74
-
75
-
76
-
77
-
78
-
79
-
80
-
81
-
82
-
83
-
84
-
85
-
86
-
87
-
88
-
89
-
90
-
91
-
92
-
93
-
94
-
95
-
96
-
97
-
98
-
99
-
100
-
101
-
102
-
103
-
104
-
105
-
106
-
107
-
108
-
109
-
110
-
111
-
112
-
113
-
114
-
115
-
116
-
117
-
118
-
119
-
120
-
121
-
122
-
123
-
124
-
125
-
126
-
127
-
128
-
129
-
130
-
131
-
132
-
133
-
134
-
135
-
136
-
137
-
138
-
139
-
140
-
141
-
142
-
143
-
144
-
145
-
146
-
147
-
148
-
149
-
150
-
151
-
152
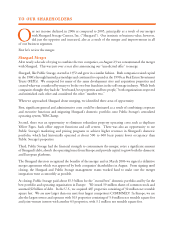
 |
 |

c
omplement our existin
g
franchise. Since 2004, we have invested $618 million to acquire 89 facilitie
s
with approximately 6.4 million net rentable square feet. Durin
g
2006, these facilities
g
enerated
$40 million of net operating income (before depreciation) for a yield of 6.3%. As with our developmen
t
p
roperties, we expect t
h
ese returns to improve as we are a
bl
e to increase renta
l
rates
f
rom promotiona
l
lease-up rates and achieve stabilized occupancies.
Anci
ll
ary Business Operation
s
O
ur ancillary businesses – including tenant reinsurance, merchandise sales (locks and boxes), consume
r
truc
k
renta
l
(
b
ot
h
our own an
d
as an agent o
f
Pens
k
e), commercia
l
property an
d
t
h
ir
d
-party propert
y
m
ana
g
ement operations – collectively continue to contribute to our operatin
g
results.
I
n 2006, net operatin
g
income of our ancillary businesses improved by
$
7 million to
$
37 million
,
benefiting from a larger group of properties. The earnings contribution from these businesses is expected
to increase as t
h
e num
b
er o
f
se
lf
-storage
f
aci
l
ities we operate continues to grow an
d
we
h
ave a
f
u
ll
year’s
ownership of the Shur
g
ard properties.
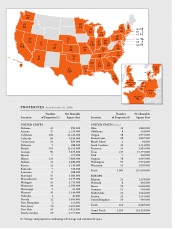
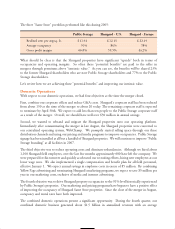
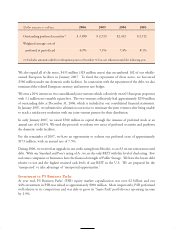
P
ercenta
g
e
(
Dollar amounts in thousands
)
2
006 2005 Chang
e
Revenues $ 93,453 $ 75,733 23%
O
peratin
g
expenses 56,030
44
,826 25
%
N
et
$
37,423
$
30,907 21%
F
inancin
g
D
uring 2006, we raised a total of $1.4 billion in capital from four series of preferred stock and a preferred
p
artners
h
ip unit security at a
bl
en
d
e
d
annua
l
rate o
f
7.1%. T
h
e net procee
d
s
f
rom t
h
is activity a
l
on
g
wit
h
c
ash on hand were used to redeem five series of preferred stock totalin
g
$1.1 billion, with a blended annual
rate of 8%, alon
g
with fundin
g
the cash requirements of the Shur
g
ard mer
g
er. Immediately upon the
c
lose of the Shurgard merger, we repaid Shurgard’s outstanding borrowings on its bank credit facility an
d
c
ertain variable rate mortgage notes totaling $671 million. In addition, all Shurgard’s outstanding
p
re
f
erre
d
stoc
k
was re
d
eeme
d
.
O
verall, the total $3.2 billion of preferred securities outstandin
g
at year end 2006 has an avera
g
e annua
l
rate of 6.9%, 120 basis points lower than in 2003.