Public Storage 2005 Annual Report Download - page 6
Download and view the complete annual report
Please find page 6 of the 2005 Public Storage annual report below. You can navigate through the pages in the report by either clicking on the pages listed below, or by using the keyword search tool below to find specific information within the annual report.-
 1
1 -
 2
2 -
 3
3 -
 4
4 -
 5
5 -
 6
6 -
 7
7 -
 8
8 -
 9
9 -
 10
10 -
 11
11 -
 12
12 -
 13
13 -
 14
14 -
 15
15 -
 16
16 -
 17
17 -
18
-
19
-
20
-
21
-
22
-
23
-
24
-
25
-
26
-
27
-
28
-
29
-
30
-
31
-
32
-
33
-
34
-
35
-
36
-
37
-
38
-
39
-
40
-
41
-
42
-
43
-
44
-
45
-
46
-
47
-
48
-
49
-
50
-
51
-
52
-
53
-
54
-
55
-
56
-
57
-
58
-
59
-
60
-
61
-
62
-
63
-
64
-
65
-
66
-
67
-
68
-
69
-
70
-
71
-
72
-
73
-
74
-
75
-
76
-
77
-
78
-
79
-
80
-
81
-
82
-
83
-
84
-
85
-
86
-
87
-
88
-
89
-
90
-
91
-
92
-
93
-
94
-
95
-
96
-
97
-
98
-
99
-
100
-
101
-
102
-
103
-
104
-
105
-
106
-
107
-
108
-
109
-
110
-
111
-
112
-
113
-
114
-
115
-
116
-
117
-
118
-
119
-
120
-
121
-
122
-
123
-
124
-
125
-
126
-
127
-
128
-
129
-
130
-
131
-
132
-
133
-
134
-
135
-
136
-
137
-
138
-
139
-
140
-
141
-
142
-
143
-
144
-
145
-
146
-
147
-
148
-
149
-
150
-
151
-
152
-
153
-
154
-
155
-
156
-
157
-
158
-
159
-
160
-
161
-
162
-
163
-
164
-
165
-
166
-
167
-
168
-
169
-
170
-
171
-
172
-
173
-
174
-
175
-
176
-
177
-
178
-
179
-
180
-
181
-
182
-
183
-
184
-
185
-
186
-
187
-
188
-
189
-
190
-
191
-
192
-
193
-
194
-
195
-
196
-
197
-
198
-
199
-
200
-
201
-
202
-
203
-
204
 |
 |
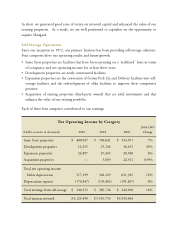
Same Store Properties
The “Same Store” portfolio comprises 1,260 properties and represents about 82% of the net
rentable square feet of our portfolio. Net operating income (before depreciation) generated
from this group increased by 7.2% in 2005 to $543 million. Revenues rose by 4.9% driven
primarily by higher rental rates and administrative fees offset by a moderate 0.5% growth in
operating expenses. Operating margins improved to 67.0% in 2005 from 65.5% in 2004.
During 2005, rental rates grew by 4.7% and occupancy levels remained stable at 91%.
Revenue per available square feet, or “REVPAF,” which takes into account rental rates,
promotional discounts and occupancy, grew by 4.7%. We are beginning 2006 on a positive
trend. Our December 2005 in-place rents are approximately 5.2% higher than December
2004. In addition, we had positive net absorption of over 1,000 customers January and
February 2006, which is typically a negative absorption period.
In last year’s report, we commented that we were not pleased with the efficacy of our marketing
and promotion programs. Costs were rising and customer volumes were declining. While I
believe this is still an area of tremendous opportunity for us, we made substantial improvements
during 2005.
For the year, move-in volume declined by about 20,000 customers to 596,000; however, this was
offset by a decline in move-out volume of almost the same amount to 597,000 customers. Our
total acquisition costs (the sum of Yellow Pages, media, promotional discounts and our
national call center) per customer move-in remained about the same, at approximately $150
per customer. However, because we were able to achieve higher rental rates and fees, net
customer acquisition costs (costs net of rental rates and administrative fees) declined by about $4
per customer move-in, thereby improving the profitability of our rental activity.
We also continue to expand and refine our marketing channels. In 2005, we succeeded at
increasing the move-in volume and traffic generated from the internet, in part, due to the
redesign of our website. We plan to expand this marketing channel during 2006.
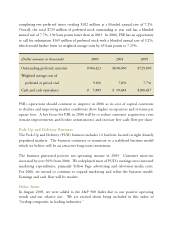
Operating expenses increased by 0.5% in 2005 compared to 4.6% in 2004. Removing
Pick-Up and Delivery and consumer truck rental service from the national call center in late
2004 produced cost savings of 26%, or approximately $3 million in 2005. A softer insurance
renewal market, along with improved cost controls, lowered property insurance costs by 10%,
or approximately $1 million. Our largest expense category, payroll, declined 2%, or a savings