Public Storage 2005 Annual Report Download - page 5
Download and view the complete annual report
Please find page 5 of the 2005 Public Storage annual report below. You can navigate through the pages in the report by either clicking on the pages listed below, or by using the keyword search tool below to find specific information within the annual report.-
 1
1 -
 2
2 -
 3
3 -
 4
4 -
 5
5 -
 6
6 -
 7
7 -
 8
8 -
 9
9 -
 10
10 -
 11
11 -
 12
12 -
 13
13 -
 14
14 -
 15
15 -
 16
16 -
17
-
18
-
19
-
20
-
21
-
22
-
23
-
24
-
25
-
26
-
27
-
28
-
29
-
30
-
31
-
32
-
33
-
34
-
35
-
36
-
37
-
38
-
39
-
40
-
41
-
42
-
43
-
44
-
45
-
46
-
47
-
48
-
49
-
50
-
51
-
52
-
53
-
54
-
55
-
56
-
57
-
58
-
59
-
60
-
61
-
62
-
63
-
64
-
65
-
66
-
67
-
68
-
69
-
70
-
71
-
72
-
73
-
74
-
75
-
76
-
77
-
78
-
79
-
80
-
81
-
82
-
83
-
84
-
85
-
86
-
87
-
88
-
89
-
90
-
91
-
92
-
93
-
94
-
95
-
96
-
97
-
98
-
99
-
100
-
101
-
102
-
103
-
104
-
105
-
106
-
107
-
108
-
109
-
110
-
111
-
112
-
113
-
114
-
115
-
116
-
117
-
118
-
119
-
120
-
121
-
122
-
123
-
124
-
125
-
126
-
127
-
128
-
129
-
130
-
131
-
132
-
133
-
134
-
135
-
136
-
137
-
138
-
139
-
140
-
141
-
142
-
143
-
144
-
145
-
146
-
147
-
148
-
149
-
150
-
151
-
152
-
153
-
154
-
155
-
156
-
157
-
158
-
159
-
160
-
161
-
162
-
163
-
164
-
165
-
166
-
167
-
168
-
169
-
170
-
171
-
172
-
173
-
174
-
175
-
176
-
177
-
178
-
179
-
180
-
181
-
182
-
183
-
184
-
185
-
186
-
187
-
188
-
189
-
190
-
191
-
192
-
193
-
194
-
195
-
196
-
197
-
198
-
199
-
200
-
201
-
202
-
203
-
204
 |
 |

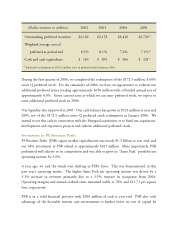
In short, we generated good rates of return on invested capital and enhanced the value of our
existing properties. As a result, we are well positioned to capitalize on the opportunity to
acquire Shurgard.
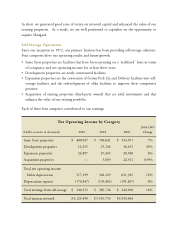
Self-Storage Operations
Since our inception in 1972, our primary business has been providing self-storage solutions.
Four categories drive our operating results and future growth.
• Same Store properties are facilities that have been operating on a “stabilized” basis in terms
of occupancy and net operating income for at least three years.
•Development properties are newly constructed facilities.
•Expansion properties are the conversion of former Pick-Up and Delivery facilities into self-
storage facilities and the redevelopment of older facilities to improve their competitive
position.
• Acquisition of existing properties (third-party owned) that are solid investments and that
enhance the value of our existing portfolio.
Each of these four categories contributed to our earnings.
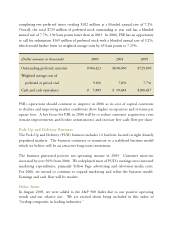
Net Operating Income by Category
2004-2005
(Dollar amounts in thousands) 2003 2004 2005 Change
Same Store properties $ 480,047$ 506,641 $ 543,0717%
Development properties 12,255 25,124 36,435 45%
Expansion properties 24,89727,265 28,948 6%
Acquisition properties — 3,099 22,911 639%
Total net operating income
before depreciation 517,199 562,129 631,365 12%
Depreciation expense (176,847)(176,403) (191,267)8%
Total earnings from self-storage $ 340,352$ 385,726 $ 440,098 14%
Total amount invested$ 5,125,498 $ 5,510,750 $5,930,484