Public Storage 2005 Annual Report Download - page 11
Download and view the complete annual report
Please find page 11 of the 2005 Public Storage annual report below. You can navigate through the pages in the report by either clicking on the pages listed below, or by using the keyword search tool below to find specific information within the annual report.-
 1
1 -
 2
2 -
 3
3 -
 4
4 -
 5
5 -
 6
6 -
 7
7 -
 8
8 -
 9
9 -
 10
10 -
 11
11 -
 12
12 -
 13
13 -
 14
14 -
 15
15 -
 16
16 -
 17
17 -
 18
18 -
 19
19 -
 20
20 -
 21
21 -
 22
22 -
23
-
24
-
25
-
26
-
27
-
28
-
29
-
30
-
31
-
32
-
33
-
34
-
35
-
36
-
37
-
38
-
39
-
40
-
41
-
42
-
43
-
44
-
45
-
46
-
47
-
48
-
49
-
50
-
51
-
52
-
53
-
54
-
55
-
56
-
57
-
58
-
59
-
60
-
61
-
62
-
63
-
64
-
65
-
66
-
67
-
68
-
69
-
70
-
71
-
72
-
73
-
74
-
75
-
76
-
77
-
78
-
79
-
80
-
81
-
82
-
83
-
84
-
85
-
86
-
87
-
88
-
89
-
90
-
91
-
92
-
93
-
94
-
95
-
96
-
97
-
98
-
99
-
100
-
101
-
102
-
103
-
104
-
105
-
106
-
107
-
108
-
109
-
110
-
111
-
112
-
113
-
114
-
115
-
116
-
117
-
118
-
119
-
120
-
121
-
122
-
123
-
124
-
125
-
126
-
127
-
128
-
129
-
130
-
131
-
132
-
133
-
134
-
135
-
136
-
137
-
138
-
139
-
140
-
141
-
142
-
143
-
144
-
145
-
146
-
147
-
148
-
149
-
150
-
151
-
152
-
153
-
154
-
155
-
156
-
157
-
158
-
159
-
160
-
161
-
162
-
163
-
164
-
165
-
166
-
167
-
168
-
169
-
170
-
171
-
172
-
173
-
174
-
175
-
176
-
177
-
178
-
179
-
180
-
181
-
182
-
183
-
184
-
185
-
186
-
187
-
188
-
189
-
190
-
191
-
192
-
193
-
194
-
195
-
196
-
197
-
198
-
199
-
200
-
201
-
202
-
203
-
204
 |
 |

0
50%
100%
150%
200%
250%
50%
0%
100%
150%
200%
250%
5% 3%
50%
247%
139%
102%
12%
One-Year Three-Year Five-Year
Public Storage
S&P 500 Index
NAREIT Equity Index
25%
135%
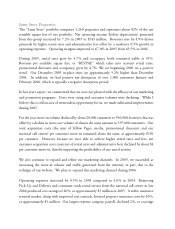
To maintain our income tax status as a REIT and avoid corporate income taxes, we are
required to distribute our taxable income. As a result of our operating results and the
expectation of continued positive performance, our Board of Directors increased the
common dividend by 11% to an annual level of $2.00 per share in August.
Our owners have enjoyed solid returns over the last several years. Looking at the one-year
(2005), three-year (2003-2005) and five-year (2001-2005) return to owners, we have
exceeded both the S&P 500 and NAREIT Equity indices for the short and long term.
Total Shareholder Returns
2001-2005
This is the “rear-view mirror.” While both our operating performance and growth
prospects have improved significantly over this period, it is almost certain that we will not
achieve these kinds of returns going forward.
Conclusion and Outlook
We have continuously said self-storage is a great business. Why? There are several reasons.
•Broad consumer awareness. A recent Wall Street Journal article cited a survey which
found one in 11 households now rents a self-storage unit compared to one in
17 households ten years ago.
•Low break-even point. A newly developed facility at a 30% to 35% occupancy level will
generally cover its fixed operating costs, consisting primarily of payroll, utilities,
property taxes and marketing costs. After “break-even,” the property generates positive
free cash flow.