Pepsi 2005 Annual Report Download - page 3
Download and view the complete annual report
Please find page 3 of the 2005 Pepsi annual report below. You can navigate through the pages in the report by either clicking on the pages listed below, or by using the keyword search tool below to find specific information within the annual report.-
 1
1 -
 2
2 -
 3
3 -
 4
4 -
 5
5 -
 6
6 -
 7
7 -
 8
8 -
 9
9 -
 10
10 -
 11
11 -
 12
12 -
 13
13 -
 14
14 -
15
-
16
-
17
-
18
-
19
-
20
-
21
-
22
-
23
-
24
-
25
-
26
-
27
-
28
-
29
-
30
-
31
-
32
-
33
-
34
-
35
-
36
-
37
-
38
-
39
-
40
-
41
-
42
-
43
-
44
-
45
-
46
-
47
-
48
-
49
-
50
-
51
-
52
-
53
-
54
-
55
-
56
-
57
-
58
-
59
-
60
-
61
-
62
-
63
-
64
-
65
-
66
-
67
-
68
-
69
-
70
-
71
-
72
-
73
-
74
-
75
-
76
-
77
-
78
-
79
-
80
 |
 |

1
1
$ in Millions
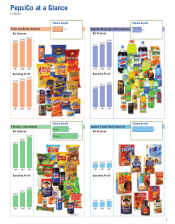
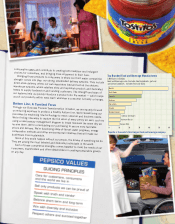
PepsiCo at a Glance
2004
$9,560
2003
$9,091
2005
$10,322
2004
$2,389
2003
$2,242
2005
$2,529
Frito-Lay North America
Net Revenue
Net Revenue
Operating Profit
2004
$9,862
2005
$11,376
2003
$8,678
2004
$1,323
2003
$1,061
2005
$1,607
PepsiCo International
2004
$8,313
2003
$7,733
2005
$9,146
2004
$1,911
2003
$1,690
2005
$2,037
PepsiCo Beverages North America
Net Revenue
Net Revenue
Operating Profit
Operating Profit Operating Profit
2004
$1,526
2003
$1,467
2005
$1,718
2004
$475
2003
$470
2005
$537
Quaker Foods North America
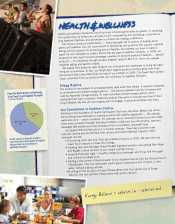
4.5%
7%
11%
Snacks
Beverages
Volume Growth
4%
Volume Growth
Volume Growth
9%
Volume Growth