Pepsi 2005 Annual Report Download - page 17
Download and view the complete annual report
Please find page 17 of the 2005 Pepsi annual report below. You can navigate through the pages in the report by either clicking on the pages listed below, or by using the keyword search tool below to find specific information within the annual report.-
 1
1 -
2
-
3
-
4
-
5
-
6
-
 7
7 -
 8
8 -
 9
9 -
 10
10 -
 11
11 -
 12
12 -
 13
13 -
 14
14 -
 15
15 -
 16
16 -
 17
17 -
 18
18 -
 19
19 -
 20
20 -
 21
21 -
 22
22 -
 23
23 -
 24
24 -
 25
25 -
 26
26 -
 27
27 -
28
-
29
-
30
-
31
-
32
-
33
-
34
-
35
-
36
-
37
-
38
-
39
-
40
-
41
-
42
-
43
-
44
-
45
-
46
-
47
-
48
-
49
-
50
-
51
-
52
-
53
-
54
-
55
-
56
-
57
-
58
-
59
-
60
-
61
-
62
-
63
-
64
-
65
-
66
-
67
-
68
-
69
-
70
-
71
-
72
-
73
-
74
-
75
-
76
-
77
-
78
-
79
-
80
 |
 |

15
Europe’s largest snack food company, with operations in Holland, France,
Belgium, Spain, Portugal, Greece, the Baltics, Hungary and Russia.
Adding Star Foods to our portfolio strengthened our position as Poland’s mar-
ket leader in potato chips and gave us the largest position in the broader savory
snack category, which includes potato chips, pretzels, nuts and extruded snacks.
We also acquired Sakata Australia, the market leader in rice snacks. This
allows us to offer a wider array of choices in “better-for-you” snacks to con-
sumers in Australia and other countries.
In Germany, we expanded and strengthened our beverage portfolio with the
acquisition of Punica Getränke GmbH, a leading maker of fruit juices and
juice drinks. The purchase dramatically expanded our juice business in
continental Europe.
In the Netherlands, Belgium and France, we are waiting for regulatory
approval to complete the acquisition of Sara Lee Corporation’s European nut
business in these countries, to further expand our market presence.
Take Advantage of Our Scale
We continually seek opportunities to take greater advantage of the combined scale
of our business. For example, in the United Kingdom we have Power of One teams
calling on customers to offer both beverages and snacks. In Mexico, we conduct
joint promotions that include both Pepsi products and Sabritas snacks. And, in
many parts of the world, we have merged our snack and beverage organizations to
operate more efficiently, broadening the skills of our people and encouraging
cross-business sharing of ideas.
Coordinated purchasing has driven substantial productivity gains; we buy
through PepsiCo’s Global Procurement group for strategic materials and through
regional procurement systems where it makes more sense to source locally. This
has contributed to steady improvement in operating margins since 2002.
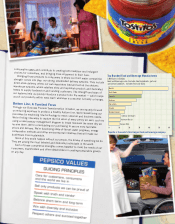
0 2 4 6 8 10 12 14
United Kingdom/Europe/Middle East/Africa
Asia/Pacific
Latin America
0 2 4 6 8 10 12 14
United Kingdom/Europe/Middle East/Africa
Asia/Pacific
Latin America
Snack Volume Growth by Region
% System Volume Growth
PepsiCo International beverages and snacks generated growth
across all regions.
Beverage Volume Growth by Region
% System Volume Growth
PepsiCo products are
available in more
than 200 countries
and territories.
Snacks and Foods 72%
Beverages
28%
Net Revenues Outside
North America
% Net Revenues
Nearly three-fourths of PepsiCo
International revenues are generated
by snacks and foods.