Pepsi 2005 Annual Report Download
Download and view the complete annual report
Please find the complete 2005 Pepsi annual report below. You can navigate through the pages in the report by either clicking on the pages
listed below, or by using the keyword search tool below to find specific information within the annual report.
-
1
-
2
-
3
-
4
-
5
-

6
-
7
-
8
-
9
-
10
-
11
-

12
-
13
-
14
-
15
-
16
-
17
-
18
-
19
-
20
-
21
-
22
-
23
-
24
-
25
-
26
-
27
-
28
-
29
-
30
-
31
-
32
-
33
-
34
-
35
-
36
-
37
-
38
-
39
-
40
-
41
-
42
-
43
-
44
-
45
-
46
-
47
-
48
-
49
-
50
-
51
-
52
-
53
-
54
-
55
-
56
-
57
-
58
-
59
-
60
-
61
-
62
-
63
-
64
-
65
-
66
-
67
-
68
-
69
-
70
-
71
-
72
-
73
-
74
-
75
-
76
-
77
-
78
-
79
-
80
Table of contents
-
Page 1
-
Page 2
...% 38% Frito-Lay North America PepsiCo Beverages North America
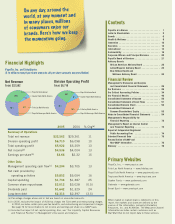
2005 Summary of Operations Total net revenue Division operating profit Total operating profit Net income(b) Earnings per Other Data Management operating cash flow(c) Net cash provided by operating activities Capital spending Common share...
-
Page 3
...2005
2003
2004
2005
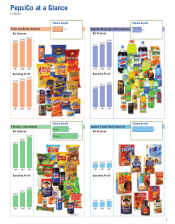
Volume Growth
Volume Growth
7%
PepsiCo International
Net Revenue
$11,376 $9,862 $8,678
Quaker Foods North America
Net Revenue
11% 9%
Snacks Beverages
$1,467 2003
$1,526
$1,718
2003
2004
2005
2004
2005
Operating Profit
Operating Profit
$1,607 $1,323 $1,061
$470...
-
Page 4
... systems - generated industry leading results. • Volume grew 7%. • Net revenue grew 11%. • Division operating profit grew 10%. • Earnings per share grew 15%.* • Total return to shareholders was 15% compared with 5% for the S&P. • Cash flow from operations was $5.9 billion and management...
-
Page 5
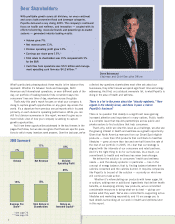
..., China, India and Russia. We're very proud of the growth generated through our brands. Our performance is directly attributable to the passionate people who run our businesses in our international markets, each and every day of the year, adapting our products, packaging and distribution systems to...
-
Page 6
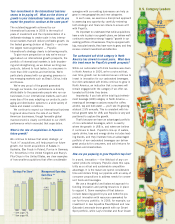
...costs through productivity programs and hedging strategies, and expect to carefully manage pricing to help offset some of the inflation.
PepsiCo's businesses generate a great deal of cash, and the Company's balance sheet is very conservative. Why don't you put more debt on the balance sheet and use...
-
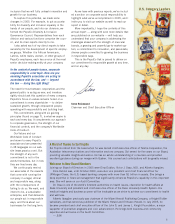
Page 7
...- will help you understand that your company is addressing the challenges ahead with the strength of muscular brands, a growing and powerful go-to-market system, a commitment to innovation, and passionate, diverse people committed to growing the business in responsible ways. This is the PepsiCo that...
-
Page 8
... the decisions that drive the business come from tens of thousands of PepsiCo asso ciates throughout the world who develop, manufacture and deliver our prod ucts. Empowered people act and think in ways that get the job done, and innovate to find new ways to achieve growth. "Responsibility and Trust...
-
Page 9
... nology to meet customer and busi ness need s. We're finding new ways to capture the full value of every penny we earn , such as using a new treasury management program to invest revenues the sam e day we receive them. We're consolidating our purchasing to secure more favo rabl e prices and delivery...
-
Page 10
... seven reduced calories and are fortified examples include: We were the first -Lay branded products in 2003. • Eliminating trans fats from Frito change. major food company to make this ing Take Heart Quaker Oatmeal varieties, and add ant Inst r • Creating new reduced-suga instant oatmeal line-up...
-
Page 11
...has partnered with Fundaci In Mexico, the PepsiCo Foundation cise. exer and its hab ng h which encourages healthy eati an energy balance program for yout
Educators Our Commitment to Schools and That's why right food and beverage choices, too.
the Schools want to provide children with t products in...
-
Page 12
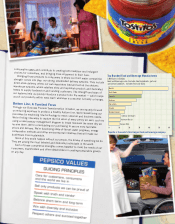
... worldwide retail sales: $85 billion
Whether it's a new product, improvement to an existing product, new packaging or a unique promotion, we're relentless in our drive to keep our products relevant to consumers.
March of New Products
Early in the year, Pepsi-Cola North America capitalized on our...
-
Page 13
Hundreds of innovations help drive our growth in international markets. Pepsi Cino, the first cola-coffee flavor combination from a major beverage company, was a dynamic new entry to the carbonated soft drink arena. 7UP H2O, a sugar-free sparkling water infused with the flavor of 7UP, was launched ...
-
Page 14
...way, from tiny convenience stores to the largest supermarkets, helping us distribute new product offerings in record time. In 2005, we started to add 475 new distribution routes at Frito-Lay in the United States - our largest addition in nearly a decade. Internationally, our sales force of almost 35...
-
Page 15
... PepsiCo's investments, they teamed with Citigroup to develop a web-based tool called "TreasuryVision" that provides views of real-time balances, cash positions, investments and borrowings worldwide. Every day, in countries around the world, our sales force receives payments from stores for products...
-
Page 16
.... opportun
% System Volume by Region Includes Pepsi-Cola, 7UP, Gat orade, Tropicana and other beverag es.
PepsiCo Beverage Volume Outside North America
United Kingdom/ Europe/ Middle East/Africa 45%
Asia/Pacific 26%
Latin America 29%
PepsiCo beverages are dist ributed locally by company-owned...
-
Page 17
...
Net Revenues Outside North America
% Net Revenues
Snacks and Foods 72%
Beverages 28%
Snack Volume Growth by Region
% System Volume Growth
United Kingdom/Europe/Middle East/Africa Asia/Pacific Latin America 0 2 4 6 8 10 12 14
siCo Nearly three-fourths of Pep generated International revenues...
-
Page 18
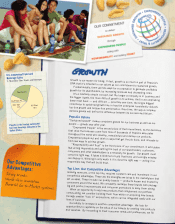
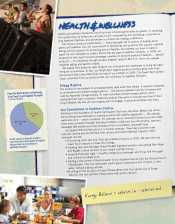
• Values • Diversity and Inclusion • Health and Wellness • Water • Packaging
Focus A reas
Sustainability lives at the intersec tion of public and business interest s. It encompasses citizenship and corporate social resp onsibility, which are about doing the right things for society and ...
-
Page 19
... base helps us better understand custome rs and consumers. A focus on developing an inclusive atmosphere where all associates feel they can succeed helps PepsiCo succeed. Each of our employee networks is represented at the most senior leve ls by an executive reporting to our chief executive offic er...
-
Page 20
... Pepsi India, where water ifers. In countries like aqu e tor res p hel et to r harvest rainwate rastructure to help me building community inf are we , that ere for sev ply be water sup shortages can Pepsi-Cola increased the le, mp exa for ia, Ind a, needs. In Keral lls. nity by digging new we use...
-
Page 21
... are mascot helped build awAIDS Day. of HIV/AIDS on World
Selected Awards
ilanthropy: • Mexican Center for Ph siness in bu ck Sabritas, our sna ocially Mexico, is named a "S ." ess sin Bu ble Responsi ca: • Frito-Lay North Ameri n Agency tio tec Pro al ent nm Enviro Year (EPA) Star Partner of...
-
Page 22
...
PepsiCo International
700 Anderson Hill Road Purchase, NY 10577 914-253-2000
Margaret D. Moore
Senior Vice President, Human Resources 58. 32 years.
Corporate Officers
Steven S Reinemund
Chairman of the Board and Chief Executive Officer 57. 21 years.
Michael D. White
Chairman and Chief Executive...
-
Page 23
...
Former Chairman of the Board and Chief Executive Officer, International Business Machines 71. Elected 1991.
Victor J. Dzau, M.D.
Chancellor for Health Affairs, President & Chief Executive Officer, Duke University Health Systems, Duke University Medical Center 60. Elected 2005.
Arthur C. Martinez...
-
Page 24
... President and Chief Executive Officer, The Partnership Joined 2002.
Darwin N. Davis, Sr.
Consultant, Retired Senior Vice President, AXA/Equitable Joined 1999.
Robert Holland
Partner, Williams Capital Joined 1999.
Jerri DeVard
Senior Vice President, Brand Management and Marketing Communications...
-
Page 25
... R. Fernández, Ph.D.
President, Lehman College, The City University of New York Joined 2003.
Irene Rosenfeld
Chairman and Chief Executive Officer, Frito-Lay North America Joined 2004.
Isabel Valdés
Consultant, Author, Public Speaker Joined 2001.
Victor Arias, Jr.
Partner, Heidrick & Struggles...
-
Page 26
...Kenneth Gladish, Ph.D.
National Executive Director, YMCA of the USA Joined 2003.
Brock Leach
Retired Senior Vice President, New Growth Platforms and Chief Innovation Officer, PepsiCo Joined 2003.
Pamela Peeke, M.D., M.P.H.
Assistant Professor, University of Maryland School of Medicine, Expert and...
-
Page 27
... Operations - Division Review ...43 Frito-Lay North America...44 PepsiCo Beverages North America ...45 PepsiCo International ...46 Quaker Foods North America...47 Our Liquidity, Capital Resources and Financial Position 48
Management's Responsibility for Financial Reporting Management's Report...
-
Page 28
...based snacks, carbonated and non-carbonated beverages and foods. We are organized into four divisions: • Frito-Lay North America, • PepsiCo Beverages North America, • PepsiCo International, and • Quaker Foods North America. Our North American divisions operate in the United States and Canada...
-
Page 29
... company-owned and franchise bottler sales of beverages bearing our trademarks to independent distributors and retailers.
Quaker Foods North America Quaker Foods North America (QFNA) manufactures or uses contract manufacturers, markets and sells cereals, rice, pasta and other branded products...
-
Page 30
... to customer warehouses and retail stores. These less costly systems generally work best for products that are less fragile and perishable, have lower turnover, and are less likely to be impulse purchases. Foodservice and Vending Our foodservice and vending sales force distributes snacks, foods and...
-
Page 31
... information technology, • supply chain, • retail consolidation and the loss of major customers, • global economic and environmental conditions, • the regulatory environment, • workforce retention, • raw materials and energy, • competition, and • market risks.
Demand for our products...
-
Page 32
... demand. Economic conditions in North America could also adversely impact growth. For example, rising fuel costs may impact the sales of our products in convenience stores where our products are generally sold in higher margin single serve packages. Our international operations accounted for over...
-
Page 33
... the cost of our raw materials and energy, • foreign exchange rates, • interest rates, • stock prices, and • discount rates affecting the measurement of our pension and retiree medical liabilities.
In the normal course of business, we manage these risks through a variety of strategies...
-
Page 34
...of these increased costs through our hedging strategies and ongoing productivity initiatives. Foreign Exchange Financial statements of foreign subsidiaries are translated into U.S. dollars using period-end exchange rates for assets and liabilities and weighted-average exchange rates for revenues and...
-
Page 35
...and Cautionary Statements We discuss expectations regarding our future performance, such as our business outlook, in our annual and quarterly reports, press releases, and other written and oral statements. These "forward-looking statements" are based on currently available competitive, financial and...
-
Page 36
..., or are expected to have, a material impact on our consolidated financial statements.
Revenue Recognition
Our products are sold for cash or on credit terms. Our credit terms, which are established in accordance with local and industry practices, typically require payment within 30 days of delivery...
-
Page 37
..., as discussed above. Bad debt expense is classified within selling, general and administrative expenses in our Consolidated Statement of Income.
Brand and Goodwill Valuations
We sell products under a number of brand names, many of which were developed by us. The brand development costs are...
-
Page 38
... our shareholders. Historically, following competitive market practices, we have used stock option grants as our primary form of long-term incentive compensation. These grants are made at the current stock price, meaning each employee's exercise price is equivalent to our stock price on the date of...
-
Page 39
... model estimates the expected value our employees will receive from the options based on a number of assumptions, such as interest rates, employee exercises, our stock price and dividend yield. Our weighted-average fair value assumptions include:
Expected life Risk free interest rate Expected...
-
Page 40
..., our pension plan investment strategy and our expectations for long-term rates of return. Our pension plan investment strategy is reviewed annually and is based upon plan liabilities, an evaluation of market conditions, tolerance for risk, and cash requirements for benefit payments. We use a third...
-
Page 41
... than expected returns and past asset losses, which account for approximately $36 million of the increase, as well as assumption changes and demographic experience, which account for approximately $20 million of the increase. Pension service costs, measured at a fixed discount rate but including...
-
Page 42
...$57 $(55) - - - $(0.27) $0.03 $(0.03) - - -
Net Tax Benefits - Continuing Operations In the fourth quarter of 2004, we recognized $45 million of tax benefits related to the completion of the U.S. Internal Revenue Service (IRS) audit for pre-merger Quaker open tax years. In the third quarter of 2004...
-
Page 43
... - Consolidated Review
In the discussions of net revenue and operating profit below, effective net pricing reflects the year-overyear impact of discrete pricing actions, sales incentive activities and mix resulting from selling varying products in different package sizes and in different countries...
-
Page 44
...the impact of higher debt levels, substantially offset by higher investment rates and cash balances. The tax rate increased 11.4 percentage points reflecting the $460 million tax charge related to our repatriation of undistributed international earnings, as well as the absence of income tax benefits...
-
Page 45
... Net Revenue, 2004 % Impact of: Volume Effective net pricing Foreign exchange Acquisition/divestitures % Change(b)
Net Revenue, 2004 Net Revenue, 2003 % Impact of: Volume Effective net pricing Foreign exchange Acquisition/divestitures % Change(b)
(a) For beverages sold to our bottlers, net revenue...
-
Page 46
... and convenience foods products revenue grew 13% with volume growth of 1%. Convenience foods products revenue benefited from favorable mix. The additional week contributed 2 percentage points to volume and net revenue growth. Operating profit grew 6% reflecting positive effective net pricing actions...
-
Page 47
...non-carbonated beverages and price increases taken in the first quarter, primarily on concentrate and Tropicana Pure Premium, partially offset by increased trade spending in the current year. The additional week in 2005 contributed 1 percentage point to net revenue growth. Operating profit increased...
-
Page 48
... Latin America region. Acquisitions had no significant impact on the reported total PepsiCo International beverage volume growth rate. Broad-based increases were led by double-digit growth in the Middle East, China, Argentina, Venezuela and Russia. Carbonated soft drinks and non-carbonated beverages...
-
Page 49
... spending behind new products. Favorable Canadian exchange rates contributed 1 percentage point to net revenue growth. Operating profit increased 1% reflecting the net revenue growth, substantially offset by an unfavorable cost of sales comparison and higher advertising and marketing costs. Smart...
-
Page 50
... $2.2 billion in 2006, which is above our long-term target of approximately 5% of net revenue. Planned capital spending in 2006 includes increased investments in manufacturing capacity to support growth in our China snack and beverage operations and our North American Gatorade business, as well as...
-
Page 51
... our Consolidated Statement of Cash Flows to our management operating cash flow.
Net cash provided by operating activities Capital spending Sales of property, plant and equipment Management operating cash flow
Management operating cash flow was used primarily to repurchase shares and pay dividends...
-
Page 52
... except per share amounts) Net Revenue...Cost of sales...Selling, general and administrative expenses ...Amortization of intangible assets...Restructuring and impairment charges...Merger-related costs...Operating Profit ...Bottling equity income...Interest expense...Interest income...Income from...
-
Page 53
... and other current liabilities...Income taxes payable...Net change in operating working capital...Other...Net Cash Provided by Operating Activities ...Investing Activities Snack Ventures Europe (SVE) minority interest acquisition ...Capital spending ...Sales of property, plant and equipment...Other...
-
Page 54
... per share amounts) ASSETS Current Assets Cash and cash equivalents...Short-term investments ...Accounts and notes receivable, net...Inventories...Prepaid expenses and other current assets...Total Current Assets ...Property, Plant and Equipment, net ...Amortizable Intangible Assets, net ...Goodwill...
-
Page 55
...Common Stock Capital in Excess of Par Value Balance, beginning of year...Stock-based compensation expense...Stock option exercises(a) ...Balance, end of year...Retained Earnings Balance, beginning of year...Net income ...Cash dividends declared - common ...Cash dividends declared - preferred ...Cash...
-
Page 56
...use contract manufacturers, market and sell a variety of salty, sweet and grain-based snacks, carbonated and non-carbonated beverages, and foods through our North American and international business divisions. Our North American divisions include the United States and Canada. The accounting policies...
-
Page 57
Frito-Lay North America (FLNA)
PepsiCo Beverages North America (PBNA)
PepsiCo International (PI)
Quaker Foods North America (QFNA)
2005 FLNA...PBNA...PI ...QFNA ...Total division ...Divested businesses ...Corporate ...Restructuring and impairment charges...Merger-related costs...Total...$10,322 ...
-
Page 58
... of cash and cash equivalents, short-term investments, and property, plant and equipment.
Total Assets
Capital Spending
QFNA 2% Other 27% FLNA 19% Other 12% FLNA 30%
Net Revenue
Canada 4% United Kingdom 6% Other 19%
QFNA 3% PI 31%
PBNA 20%
PI 38% PBNA 18%
Mexico 10% United States 61...
-
Page 59
... Policies Our other significant accounting policies are disclosed as follows: • Property, Plant and Equipment and Intangible Assets - Note 4 and, for additional unaudited information on brands and goodwill, see "Our Critical Accounting Policies" in Management's Discussion and Analysis. • Income...
-
Page 60
... remains. Merger-Related Costs In connection with the Quaker merger in 2001, we recognized merger-related costs of $59 million ($42 million after-tax or $0.02 per share) in 2003.
Note 4 - Property, Plant and Equipment and Intangible Assets
Average Useful Life Property, plant and equipment, net Land...
-
Page 61
... change in the book value of nonamortizable intangible assets is as follows:
Balance, Beginning 2004 Frito-Lay North America Goodwill PepsiCo Beverages North America Goodwill Brands PepsiCo International Goodwill Brands Quaker Foods North America Goodwill Corporate Pension intangible Total goodwill...
-
Page 62
... repatriation...Lower taxes on foreign results ...Settlement of prior years' audit ...Other, net...Annual tax rate ...Deferred tax liabilities Investments in noncontrolled affiliates ...Property, plant and equipment ...Pension benefits ...Intangible assets other than nondeductible goodwill...Zero...
-
Page 63
...of international employees, tenure as well. All stock option grants have an exercise price equal to the fair market value of our common stock on the day of grant and generally have a 10-year term with vesting after three years. Executive Grants All senior management and certain middle management are...
-
Page 64
...our adoption of SFAS 123R to materially impact our financial statements. Our Stock Option Activity(a)
Our weighted-average Black-Scholes fair value assumptions include:
Expected life Risk free interest rate Expected volatility Expected dividend yield
2005 6 yrs. 3.8% 23% 1.8%
2004 6 yrs. 3.3% 26...
-
Page 65
... Accounting Policies" in Management's Discussion and Analysis.
2005 Weighted-average assumptions Liability discount rate...Expense discount rate...Expected return on plan assets ...Rate of compensation increases...Components of benefit expense Service cost...Interest cost...Expected return on plan...
-
Page 66
... cost Plan amendments Participant contributions Experience loss/(gain) Benefit payments Settlement/curtailment loss Special termination benefits Foreign currency adjustment Other Liability at end of year Liability at end of year for service to date Change in fair value of plan assets Fair value...
-
Page 67
... stock at the time of investment to 10% of the fair value of plan assets.
Asset Category Equity securities Debt securities Other, primarily cash Total
Target Allocation 60% 40% - 100%
Actual Allocation 2005 2004 60% 60% 39% 39% 1% 1% 100% 100%
Retiree Medical Cost Trend Rates An average increase...
-
Page 68
... goods are reported net of bottler funding. For further unaudited information
on these bottlers, see "Our Customers" in Management's Discussion and Analysis. These transactions with our bottling affiliates are reflected in our consolidated financial statements as follows:
Net revenue Selling...
-
Page 69
... 775 959 381 256 6 1 $2,170 $1,798
(b) Includes approximately $13 million of long-term commitments which are reflected in other liabilities in our Consolidated Balance Sheet.
The above table reflects non-cancelable commitments as of December 31, 2005 based on year-end foreign exchange rates.
67
-
Page 70
... the cost of our raw materials and energy, • foreign exchange risks, • interest rates, • stock prices, and • discount rates affecting the measurement of our pension and retiree medical liabilities. In the normal course of business, we manage these risks through a variety of strategies...
-
Page 71
... market prices. Book and fair values of our derivative and financial instruments are as follows:
2005 Book Value Assets Cash and cash equivalents(a) ...Short-term investments(b) ...Forward exchange contracts(c) ...Commodity contracts(d) ...Prepaid forward contract(e) ...Cross currency interest rate...
-
Page 72
... outstanding shares of preferred stock with a fair value of $110 million and 18 million shares of common stock were held in the accounts of ESOP participants. Quaker made the final award to its ESOP plan in June 2001.
2005 Preferred stock Repurchased preferred stock Balance, beginning of year...
-
Page 73
... and benefits ...Dividends payable...Insurance accruals ...Other current liabilities...Other liabilities Reserves for income taxes...Other ...Other supplemental information Rent expense...Interest paid ...Income taxes paid, net of refunds...Acquisitions(d) Fair value of assets acquired...Cash paid...
-
Page 74
... in all countries. We have maintained strong governance policies and practices for many years. The management of PepsiCo is responsible for the objectivity and integrity of our consolidated financial statements. The Audit Committee of the Board of Directors has engaged independent registered public...
-
Page 75
... Shareholders: Our management is responsible for establishing and maintaining adequate internal control over financial reporting, as such term is defined in Rule 13a-15(f) of the Exchange Act. Under the supervision and with the participation of our management, including our Chief Executive Officer...
-
Page 76
... Public Accounting Firm
Board of Directors and Shareholders PepsiCo, Inc.: We have audited the accompanying Consolidated Balance Sheet of PepsiCo, Inc. and Subsidiaries as of December 31, 2005 and December 25, 2004 and the related Consolidated Statements of Income, Cash Flows and Common Shareholders...
-
Page 77
... operations $2.39 $2.41 $2.05 Cash dividends declared per common share $1.01 $0.850 $0.630 Total assets $31,727 $27,987 $25,327 Long-term debt $2,313 $2,397 $1,702 Return on invested capital(a) 22.7% 27.4% 27.5% Five-Year Summary (Cont.)
Net revenue Net income Income per common share - basic Income...
-
Page 78
...overyear impact of discrete pricing actions, sales incentive activities and mix resulting from selling varying products in different package sizes and in different countries. Management operating cash flow: net cash provided by operating activities less capital spending plus sales of property, plant...
-
Page 79
...
The New York Stock Exchange is the principal market for PepsiCo common stock, which is also listed on the Amsterdam, Chicago and Swiss Stock Exchanges.
Shareholder Information
Annual Meeting
The Annual Meeting of Shareholders will be held at Frito-Lay Corporate Headquarters, 7701 Legacy Drive...
-
Page 80