Olympus 2015 Annual Report Download - page 8
Download and view the complete annual report
Please find page 8 of the 2015 Olympus annual report below. You can navigate through the pages in the report by either clicking on the pages listed below, or by using the keyword search tool below to find specific information within the annual report.-
 1
1 -
 2
2 -
 3
3 -
 4
4 -
 5
5 -
 6
6 -
 7
7 -
 8
8 -
 9
9 -
 10
10 -
 11
11 -
 12
12 -
 13
13 -
 14
14 -
 15
15 -
 16
16 -
 17
17 -
 18
18 -
 19
19 -
20
-
21
-
22
-
23
-
24
-
25
-
26
-
27
-
28
-
29
-
30
-
31
-
32
-
33
-
34
-
35
-
36
-
37
-
38
-
39
-
40
-
41
-
42
-
43
-
44
-
45
-
46
-
47
-
48
-
49
-
50
-
51
-
52
-
53
-
54
-
55
-
56
-
57
-
58
-
59
-
60
-
61
-
62
-
63
 |
 |

Contribute to the development of
society through products and solutions
Back to Basics
Strive for protable growth through the
complete revision of cost structures
Profitable Growth
Share management strategies with
employees worldwide and work as a team
One Olympus
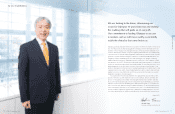
Olympus is promoting a medium-term vision for the ve years from the scal year ended March 31, 2013. Acting in accor-
dance with the vision’s slogan of “Back to Basics,” the Company aims to return to the basic values it had at founding and
make a fresh start in order to regain the credibility of its stakeholders, build itself anew, and create new corporate value.
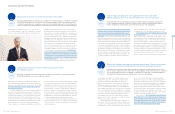
Corporate Management Policies
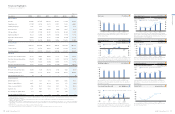
Performance Indices and Targets (Consolidated)
Results of implementing these basic strategies will be monitored based on four performance indices: return on invested capital (ROIC)*,
operating margin, free cash flow, and equity ratio.
In fiscal 2015, the operating margin, an indicator of business profitability, was 11.9% and the equity ratio, an indicator of financial
soundness, was 32.9%. Both of these were an improvement from fiscal 2014, in which the Company achieved levels targeted for fiscal
2017 three years ahead of schedule. ROIC was 8.0%, representing steady progress toward the fiscal 2017 goal for this index, while free
cash flow amounted to ¥27.2 billion, declining substantially year on year due to increases in accounts receivable and inventories.
* Return on invested capital (ROIC): At Olympus, ROIC is calculated using the following assumptions: Return (Operating income after taxes) / IC (Shareholders’ equity + Interest-bearing debt)
FY ended March
2012
(Results)
FY ended March
2013
(Results)
FY ended March
2014
(Results)
FY ended March
2015
(Results)
FY ending March
2017
(Targets)
Return on invested capital (ROIC)* 2.7% 2.7% 5.9% 8.0% 10% or more
Operating margin 4.2% 4.7% 10.3% 11.9% 10% or more
Free cash flow (Cash flows from operating
activities + Cash flows from investing activities) ¥(4.8) billion ¥58.7 billion ¥52.1 billion ¥27.2 billion ¥70.0 billion or
more
Equity ratio 4.6% 15.5% 32.1% 32.9% 30% or more
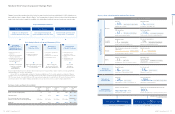
Medium-Term Vision (Corporate Strategic Plan)
* All principles of the Corporate Governance
Code will be implemented.
Change from Fiscal 2012 to Fiscal 2015
Rebuilding of Business Portfolio /
Optimizing Allocation of Management Resources
Medical
Net sales
+60% ¥349.2 billion ¥558.3 billion
Rapid growth in all fields
Operating margin
+3pt 19.5% 22.4%
Contributions from higher sales
R&D expenditures
+61% ¥26.9 billion ¥43.3 billion
Enhancement of product lineup
Capital expenditures
+136% ¥15.6 billion ¥36.8 billion
Reinforcement of domestic manufacturing sites
Scientific
Solutions
Operating margin
+1pt 5.9% 6.6%
Closure of plant in the Philippines, etc.
Net sales by industrial eld
+19% ¥49.8 billion ¥59.4 billion
Expansion of industrial field operations
Imaging
Ratio of mirrorless camera sales to total digital
camera sales
More than Double
Accelerated shift to mirrorless cameras
Manufacturing sites
–3sites 5 sites 2 sites
Revision of manufacturing systems
Others
Number of subsidiaries
–33% 208 139
Reorganization of non-core business domains
Operating income
Profitability
Achieved
Reorganization of unprofitable businesses
Review and
Reduction of Costs
Operating margin
+8pts 4.2% 11.9%
Improvement of Groupwide profitability
Cost of sales ratio
–18pts 54.8% 35.9%
Ongoing cost reductions
Restoration of
Financial Health
Equity ratio
+28pts 4.6% 32.9%
Capital alliances, issuance of new shares, etc.
Interest-bearing debt
–¥300billion
¥642.4 billion ¥354.4 billion
Halved due to early repayment
Restructuring of
Corporate Governance
Number of outside directors
More than Half
8 / 13
Management soundness ensured
Response to the Corporate Governance Code*
100%
Proactive strengthening of corporate governance system
1
2
3
4
Market capitalization 4 times higher Year-end dividend payment ¥10 per share
(1st time in 4 years)
Success Over 3-Year Period of Medium-Term Vision
¥367.3 billion ¥1,530.0 billion ¥0 ¥10
Rebuilding of
Business Portfolio /
Optimizing Allocation of
Management Resources
Restoration of
Financial Health
Review and
Reduction of Costs
Restructuring of
Corporate Governance
Basic Strategies Based on Corporate Management Policies
1. Clarification of our core
businesses
2. Identification and liquidation
of non-core businesses
3. Establishment of mechanisms
to drive optimal allocation of
management resources
Contribute to total wellness
of people as a company
centered on the
Medical Business
Improve protability of the entire
Group through drastic review
of cost structures
Improve equity ratio
as soon as possible and
realize stable management
Recover trust
and improve
corporate value
1. Cost reduction
2. Significant curtailment
of indirect expenses
1. Steady flow of profits from
businesses
2. Maximization of cash flows
3. Streamlining of assets
1. Restructuring of the
governance system
2. Reinforcement of internal
controls
3. Strengthening of the
compliance system
1 2 3 4
¥(8.0) billion ¥1.2 billion
34.2% 71.8%
13
OLYMPUS Annual Report 2015
12 OLYMPUS Annual Report 2015
Overview of Olympus