Olympus 2015 Annual Report Download - page 18
Download and view the complete annual report
Please find page 18 of the 2015 Olympus annual report below. You can navigate through the pages in the report by either clicking on the pages listed below, or by using the keyword search tool below to find specific information within the annual report.-
 1
1 -
2
-
3
-
4
-
5
-
6
-
7
-
 8
8 -
 9
9 -
 10
10 -
 11
11 -
 12
12 -
 13
13 -
 14
14 -
 15
15 -
 16
16 -
 17
17 -
 18
18 -
 19
19 -
 20
20 -
 21
21 -
 22
22 -
 23
23 -
 24
24 -
 25
25 -
 26
26 -
 27
27 -
 28
28 -
29
-
30
-
31
-
32
-
33
-
34
-
35
-
36
-
37
-
38
-
39
-
40
-
41
-
42
-
43
-
44
-
45
-
46
-
47
-
48
-
49
-
50
-
51
-
52
-
53
-
54
-
55
-
56
-
57
-
58
-
59
-
60
-
61
-
62
-
63
 |
 |

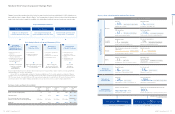
Main Areas and ProductsBusiness Segment Net SalesResults of Operations (2015/3) Operating Income (Loss) /
Operating Margin
Share of Net Sales Share of Net Sales
by Region
73.0%
Others
2.5%
Asia /
Oceania
18.2%
13.6%
11.0%
Company History
In order to allocate management resources to business domains in a more concentrated manner,
we reorganized non-core business domains, and withdrew from the biologics business in the
previous fiscal year. As a result, net sales in the Others Business amounted to ¥18.6 billion, down
29% year on year, and profitability was achieved with operating income of ¥1.2 billion.
Others
Europe
25.5%
North
America
32.7%
Japan
21.1%
1919
Established as
Takachiho Seisakusho
to manufacture micro-
scopes in Japan
1936
Semi-Olympus I, the first
Olympus camera intro-
duced, marking entry into
camera business
1920
Asahi 600x microscope
introduced
1975
Entry into medical surgical
endoscopy field
1949
Name changed
to Olympus Optical
Co., Ltd.
The Company listed
on the TSE
1996
Entry into digital camera
business
1950
Development of world’s
first practical gastrocamera
1968
Entry into industrial
endoscope field
2008
Acquisition of Gyrus Group
PLC to strengthen surgical
area of Medical Business
2009
Olympus launches its first
mirrorless interchangeable
lens camera, OLYMPUS
PEN E-P1
1969
Development of world’s
first microcassette
tape recorder
At a Glance
2.4%
33
OLYMPUS Annual Report 2015
32 OLYMPUS Annual Report 2015
Performance and Strategies by Business
Gastrointestinal Endoscopes
Endoscopy systems (videoscopes, video processors,
light sources, liquid crystal display (LCD) panels);
Peripheral equipment (image recording device,
endoscope cleaning systems, sterilization systems), etc.
Surgical Devices
Surgical video endoscopy systems, peripheral devices
for endoscopic surgery, electrosurgical knives, etc.
Endotherapy Devices
Endoscopic devices for all disciplines of endoscopy
(approximately 1,000 different devices for various
diagnostic and treatment procedures, including biopsy
forceps, high-frequency polypectomy snares, grasping
forceps, stone retrieval and lithotriptor baskets,
hemostasis accessories, etc.)
Life Science
Upright microscopes and polarizing microscopes,
inverted microscopes, laser confocal microscopes,
box-type fluorescence imaging devices, stereo
microscopes, fluorescence macromicroscopes,
microscope digital cameras, imaging software,
bio-imaging systems, virtual slide systems
Industrial
Metallurgical microscopes, semiconductor inspection
microscopes, laser microscopes, measuring
microscopes, microscopic 3D measurement systems,
industrial videoscopes, industrial fiberscopes, industrial
rigid scopes, ultrasonic flaw detectors, eddy current
flaw detectors, phased array flaw detectors, X-ray
diffraction analyzers, peripheral equipment
Digital Cameras
Mirrorless interchangeable-lens cameras, compact
digital cameras, digital camera-related products, digital
camera lens barrels, optical components
Others
IC recorders, binoculars
Double-digit sales growth was recorded in
the gastrointestinal endoscope, surgical
device, and endotherapy device fields. Sales
of mainstay gastrointestinal and surgical
endoscopes continued to increase, and sales
in North America, Europe, Asia, and other
overseas markets drove overall performance
improvements. As a result, the Medical Busi-
ness posted record-breaking figures for both
net sales and operating income for the
second consecutive year, with net sales of
¥558.3 billion, up 13% year on year, and
operating income of ¥124.9 billion, up 11%.
In the life science field, performance benefited
from contributions from the sales of our laser
scanning microscopes, which are used in
advanced life science research. In the indus-
trial field, corporate capital expenditures were
on the rise, and sales of industrial video-
scopes and ultrasonic flaw detectors were
strong as a result. In addition, structural re-
forms created improvements in profitability,
leading net sales in the Scientific Solutions
Business to increase 6% year on year, to
¥103.9 billion, and operating income to grow
39%, to ¥6.8 billion.
Net sales in the focus area of mirrorless cam-
eras increased 16% year on year following
higher sales of the OM-D series in Europe
aswell as favorable sales of interchangeable
lenses. Overall, net sales in the Imaging Busi-
ness were down 13%, to ¥83.8 billion, as
wereduced compact digital camera sales
volumes. Operating loss was ¥13.9 billion
asa result of forward-looking investments
inbusiness-to-business (BtoB) operations.
Medical Business
Scientific Solutions
Business
Imaging Business
(30)
(20)
(10)
0
10
2013/3 2014/3
(¥ Billion)
2016/3
(Forecast)
2015/3
0
(23.1)
(9.2)
(13.9)
(¥ Billion)
2013/3 2014/3 2016/3
(Forecast)
0
40
80
120
107.6
96.1
83.8
70.0
95.1
12.5
83.6
12.5
69.3
14.5
61.0
9.0
2015/3
Digital cameras
Others
Operating loss
(¥ Billion)
2013/3 2014/3 2015/3 2016/3
(Forecast)
0
250
500
750
394.7
492.3
558.3
615.0
218.7
176.1
274.0
218.3
313.3
245.1 277.6
337.4
0
50
100
150
(%)
0
5
10
15
20
25
(¥ Billion)
2013/3 2014/3 2016/3
(Forecast)
2015/3
112.7
87.1
22.1 22.9
124.9
22.4
137.0
22.3
Endoscopes
Surgical & endotherapy devices
Operating income
Operating margin (right)
(¥ Billion)
2013/3 2014/3 2016/3
(Forecast)
0
40
80
120
85.5
98.5 103.9 110.0
38.9
46.6
44.8
53.7
44.5
59.4 62.0
48.0
2015/3
Life science
Industrial
3.5
4.9
6.8
8.0
7.3
4.1
5.0
6.6
(%)
(¥ Billion)
2013/3 2014/3 2016/3
(Forecast)
2015/3
0
2
4
6
8
10
0
5
10
15
Operating income
Operating margin (right)