Olympus 2014 Annual Report Download - page 19
Download and view the complete annual report
Please find page 19 of the 2014 Olympus annual report below. You can navigate through the pages in the report by either clicking on the pages listed below, or by using the keyword search tool below to find specific information within the annual report.-
 1
1 -
2
-
3
-
4
-
5
-
6
-
7
-
8
-
 9
9 -
 10
10 -
 11
11 -
 12
12 -
 13
13 -
 14
14 -
 15
15 -
 16
16 -
 17
17 -
 18
18 -
 19
19 -
 20
20 -
 21
21 -
 22
22 -
 23
23 -
 24
24 -
 25
25 -
 26
26 -
 27
27 -
 28
28 -
 29
29 -
30
-
31
-
32
-
33
-
34
-
35
-
36
-
37
-
38
-
39
-
40
-
41
-
42
-
43
-
44
-
45
-
46
-
47
-
48
-
49
-
50
-
51
-
52
-
53
-
54
-
55
-
56
-
57
-
58
-
59
-
60
 |
 |

OmniScan SX ultrasonic phased array aw detectorsIPLEX series industrial videoscopeFLUOVIEW FVMPE-RS multi photon
laser scanning microscope
(Millions of yen)
2012/3 2013/3 2014/3
Operating Results
Net Sales 92,432 85,513 98,510
Operating Expenses 86,993 81,986 93,575
Operating Income 5,439 3,527 4,935
Operating Margin (%) 5.9 4.1 5.0
Sales by Product
Life Science 42,650 38,910 44,778
Domestic 10,560 10,315 11,855
Overseas 32,090 28,595 32,923
Industrial 49,782 46,603 53,732
Domestic 8,394 7,526 7,968
Overseas 41,388 39,077 45,764
Segment Data
R&D Expenditures (¥ Billion) 8.7 8.2 9.3
Capital Expenditures (¥ Billion) 4.3 3.4 4.5
Number of Employees(*)5,150 4,575 4,284
* Including average number of temporary employees
Industry’s top share of 30% to 40% in biological microscope market
World-leading share of 50% in industrial endoscope market
Comprehensive solutions capabilities utilizing diverse product
lineups
State-of-the-art optical technologies continually refi ned since
Company’s founding
Increased focus on advanced science research by govern-
ments of various countries and higher related budgets in
these countries following economic upturns
Rising demand for non-destructive testing equipment due to
aging of infrastructure in developed countries and installation
of infrastructure in emerging countries
Expanding demand for industrial microscopes due to growth of electronic
component industry in conjunction with spread of smartphone usage
High susceptibility to changes in economic conditions of
specifi c regions and countries
Redundant functions and ineffi ciencies resulting from busi-
ness diversifi cation
Diminished synergies in certain smaller businesses due to
portfolio expansion
Trend toward limiting capital expenditure by private-sector
companies
Delayed execution of government budgets and budget cuts
in various countries
Economic deceleration and decreasing demand in emerging
countries
S
O
W
T
Review of Business Segments
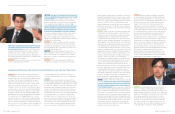
Message from the Group President
We will leverage the strengths of our technology development capabilities and high market share
to respond to a diverse range of needs while improving pro tability by revising strategies.
Effective April 1, 2014, the name of the Life Science & Industrial Business was changed to the Scienti c Solutions
Business. In this business, we will revise strategies to move away from strategies based on product lineups to pursue
those oriented toward customer groups. This shift will enable us to strategically allocate management resources
toward expanding our market share and increasing sales. At the same time, organizational integration will be
advanced to increase both business and capital ef ciency and thereby improve pro tability.
SCIENTIFIC
SOLUTIONS
BUSINESS
Shinichi Nishigaki
President, Scientific
Solutions Group
Overview of Fiscal 2014
Overseas, government budget cuts continued to create
a harsh operating environment. Domestically, however,
we began seeing an increase in budget execution among
research and medical institutions during the second half of
fi scal 2014. Activity was also brisk in Japan’s automotive
market. These factors made clear contributions to sales
growth. In the life science fi eld, sales were strong for
FLUOVIEW FVMPE-RS, a laser scanning microscope
usedto conduct advanced life science research that was
launched in fi scal 2013. The industrial fi eld, meanwhile,
saw growth in sales of new IPLEX series industrial video-
scopes, which are used to inspect jet engines. Likewise,
sales were up for products in the OmniScan SX series, a
line of miniature ultrasonic phased array fl aw detectors that
are able to inspect the inside of materials to detect fl aws
that cannot be viewed from the outside. The benefi ts from
sales of these new products resulted in a 15% increase in
net sales and a 40% rise in operating income year on year.
13.8%
Japan
20.1%
North America
23.8%
Europe
24.2%
Asia /
Oceania
24.5%
Others
7.3%
Life Science
45.5%
Industrial
54.5%
Composition (Fiscal year ended March 31, 2014)
2012/3 2013/3 2014/3 2015/3
(Forecast)
2017/3
(Target)
42.7
49.8
38.9
46.6
44.8
104.0
98.5
85.5
92.4
53.7 56.9
47.1
135.0
0
50
100
150
0
4
8
12
16
0
3
6
9
12
3.5
44.9
5
4
15.0
5.4
6
4.5
11
2012/3 2013/3 2014/3 2017/3
(Target)
2015/3
(Forecast)
Net Sales
(¥ Billion)
Operating Income / Operating Margin
(¥ Billion) (%)
Operating income Operating margin (right) Life science Industrial
Business Environment
Improvements in the business environment are being seen
supported by the execution of budgets at domestic and
overseas research and medical institutions as well as a recov-
ery trend in capital expenditure. These positive trends were
stimulated by an upward turn in global economic condi-
tions and the depreciation of the yen, a result of the economic
stimulus measures instituted by the new government
administration in Japan. In the medium-to-long term, we
expect to see the acceleration of advanced research on
such topics as induced pluripotent stem cells (iPS cells) in
the area of life science research. In addition, the market for
the Scientifi c Solutions Business’s products is projected to
expand as a result of increased infrastructure investment in
emerging countries accompanying economic development.
Share of
Net Sales
(Consolidated net sales)
Share of
Net Sales
by Product
Share of
Net Sales
by Region
Strengths
Opportunities
Weaknesses
Threats
35
OLYMPUS Annual Report 2014
34 OLYMPUS Annual Report 2014